MATLAB: An Introduction with Applications
6th Edition
ISBN: 9781119256830
Author: Amos Gilat
Publisher: John Wiley & Sons Inc
expand_more
expand_more
format_list_bulleted
Concept explainers
Question
I need help with normal curve

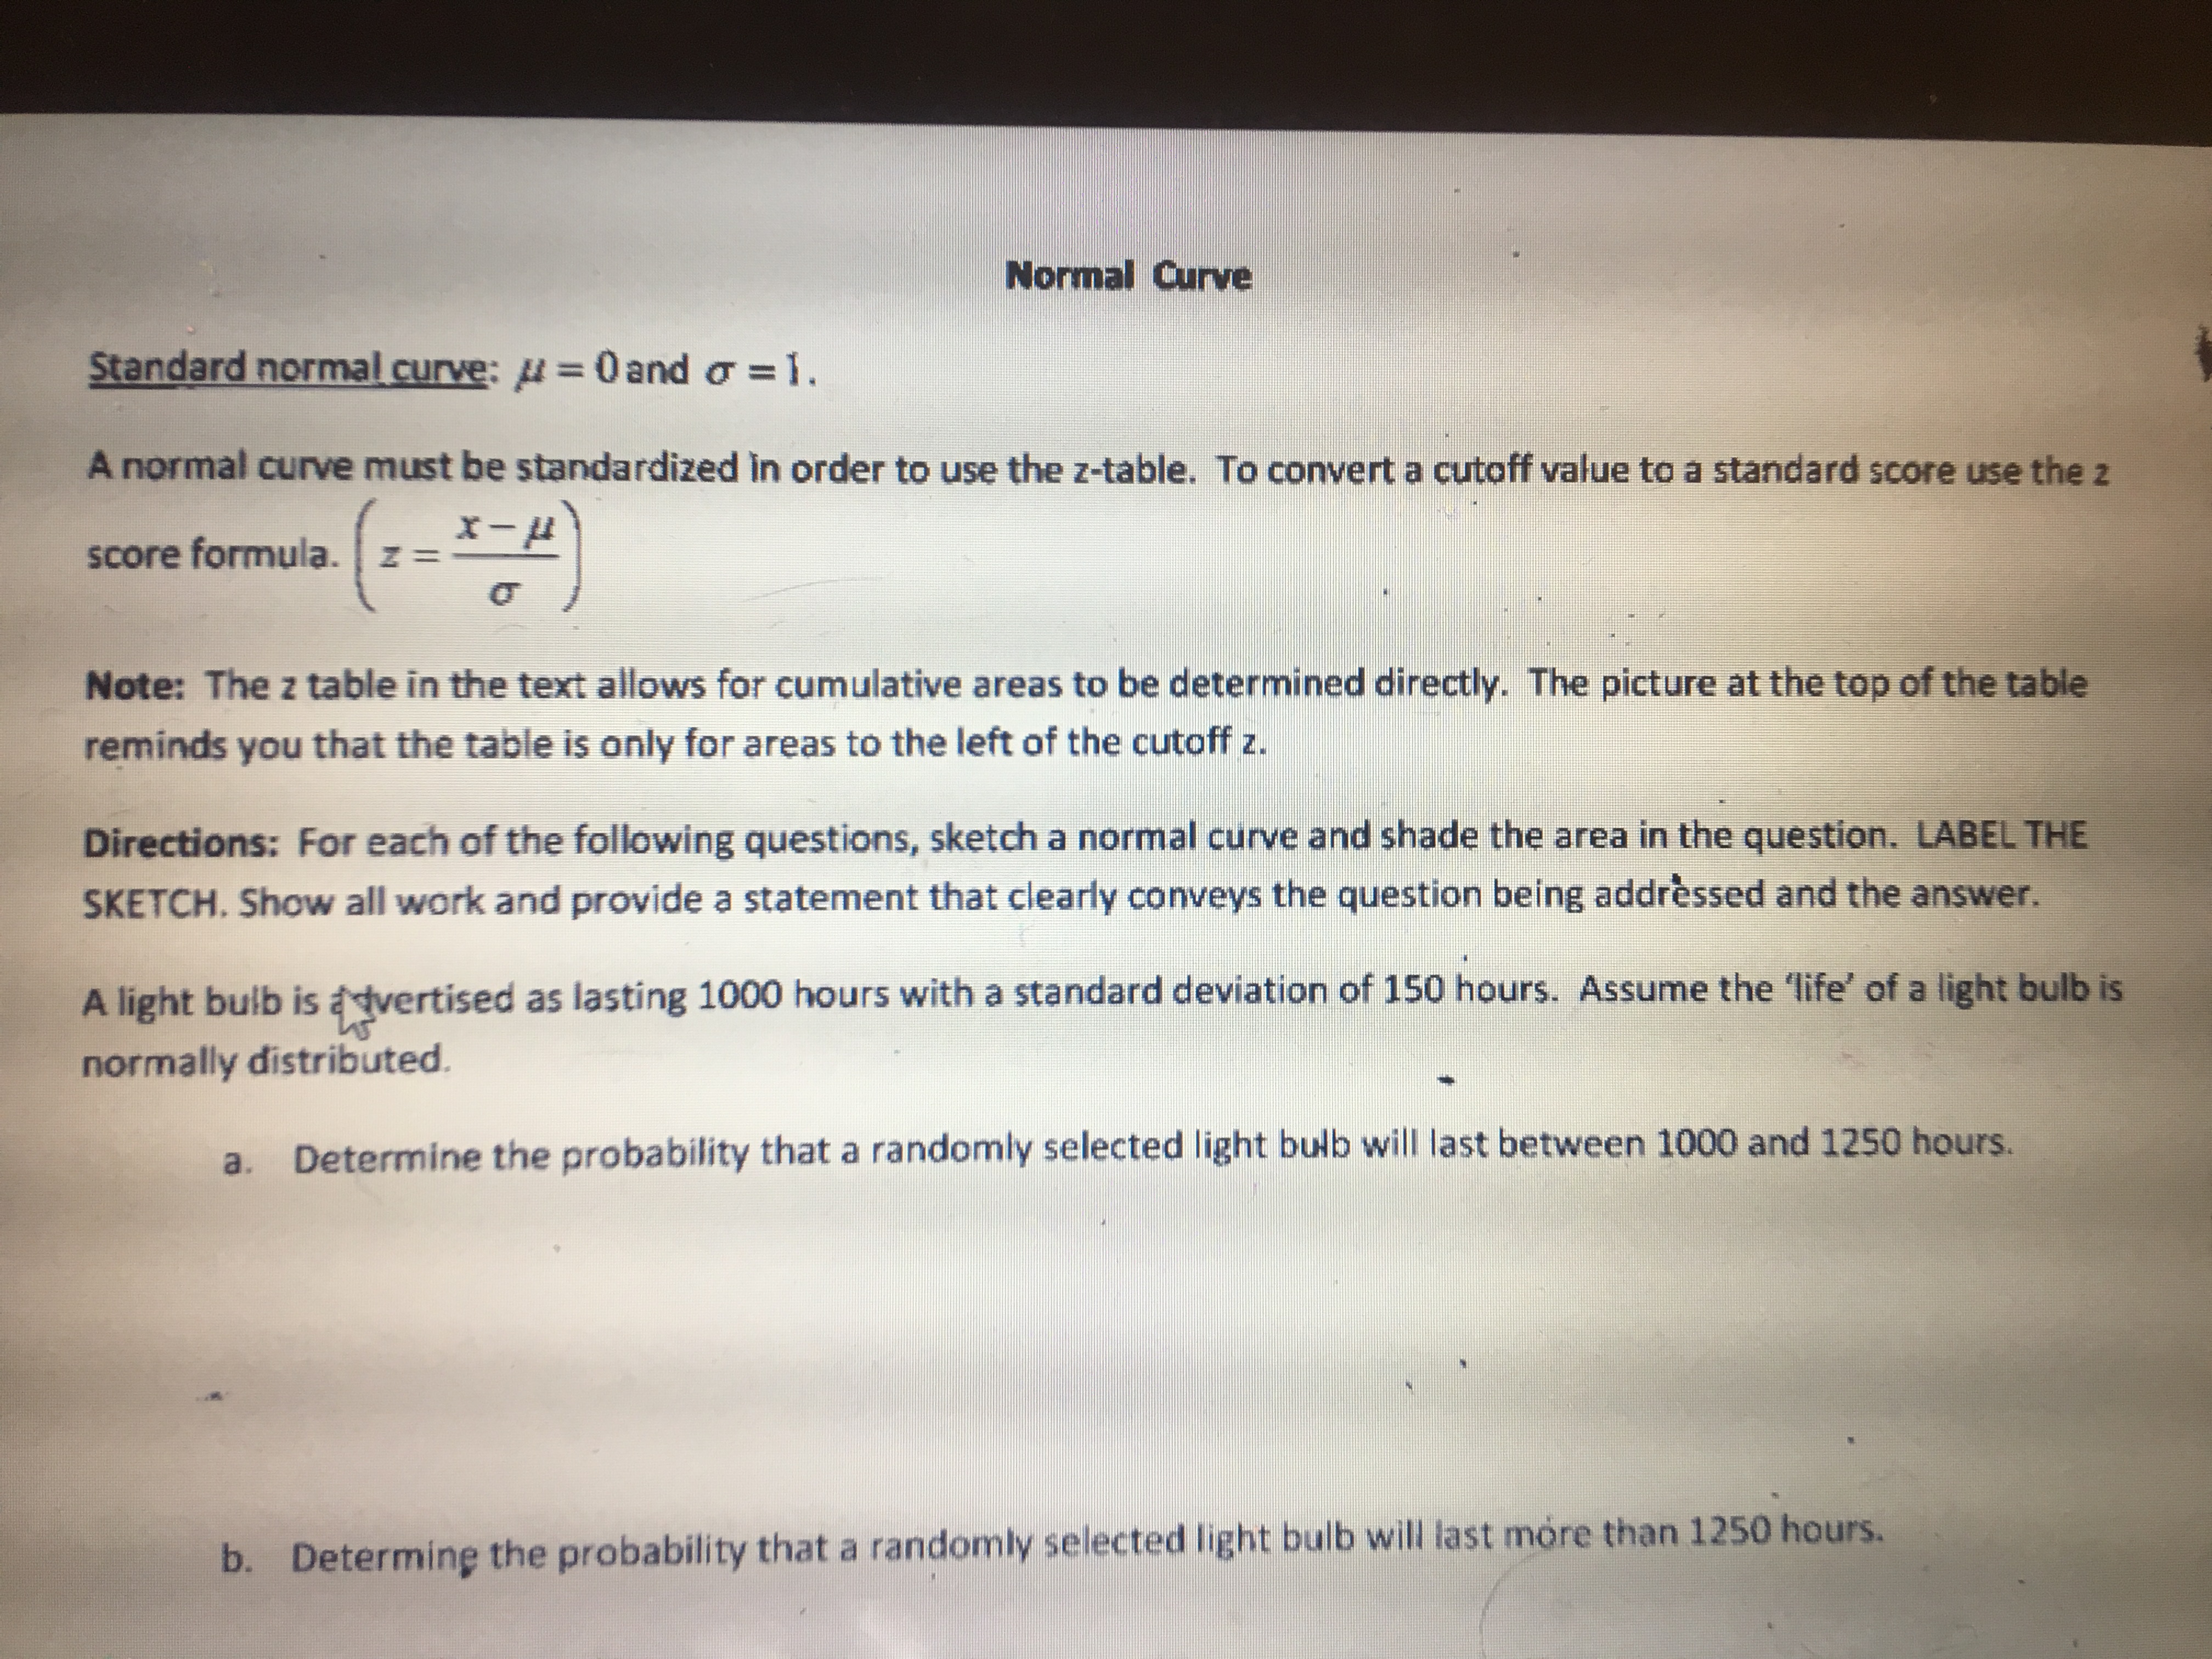
Transcribed Image Text:Normal Curve
Standard normal curve:
0 and a 1
A normal curve must be standardized in order to use the z-table. To convert a cutoff value to a standard score use the z
x-
score formula. z
Note: The z table in the text allows for cumulative areas to be determined directly. The picture at the top of the table
reminds you that the table is only for areas to the left of the cutoff z.
Directions: For each of the following questions, sketch a normal curve and shade the area in the question. LABEL THE
SKETCH. Show all work and provide a statement that clearly conveys the question being addrèssed and the answer.
A light bulb is advertised as lasting 1000 hours with a standard deviation of 150 hours. Assume the 'life' of a light bulb is
normally distributed.
Determine the probability that a randomly selected light bulb will last between 1000 and 1250 hours.
a.
light bulb will last móre than 1250 hours.
b. Determine the probability that a randomly selected
Expert Solution
This question has been solved!
Explore an expertly crafted, step-by-step solution for a thorough understanding of key concepts.
This is a popular solution
Trending nowThis is a popular solution!
Step by stepSolved in 2 steps with 2 images

Knowledge Booster
Learn more about
Need a deep-dive on the concept behind this application? Look no further. Learn more about this topic, statistics and related others by exploring similar questions and additional content below.Similar questions
- Imagine that you, a social psychologist, study people living with HIV. You are interested in the relationship between viral load, the amount of HIV in a sample of blood, and perceived stigma, the amount people with HIV perceive others to hold stigmatizing views about their condition. You have 100 people with HIV complete a perceived stigma scale, as well as provide a sample of blood, so their viral load can be measured. You run a regression analysis using the data you’ve collected to see whether perceived stigma can be predicted based on viral load. The output from the analysis is presented below: How much does the estimate of perceived stigma change if viral load increases by one unit?arrow_forwardI need help with number 14, please.arrow_forwardThe regression equation to predict the total world gross ticket sales from the opening weekend ticket sales is: WorldGross^=9.23+6.87⋅OpeningWeekend Interpret the y-intercept of the regression line in context.arrow_forward
- A researcher is using the regression model Y=61+4.5X to predict a persons score on a happiness questionnaire based on their number of friends Predict the happiness score for someone with 8 friendsarrow_forwardRange of ankle motion is a contributing factor to falls among the elderly. Suppose a team of researchers is studying how compression hosiery, typical shoes, and medical shoes affect range of ankle motion. In particular, note the variables Barefoot and Footwear2. Barefoot represents a subject's range of ankle motion (in degrees) while barefoot, and Footwear2 represents their range of ankle motion (in degrees) while wearing medical shoes. Use this data and your preferred software to calculate the equation of the least-squares linear regression line to predict a subject's range of ankle motion while wearing medical shoes, ?̂ , based on their range of ankle motion while barefoot, ? . Round your coefficients to two decimal places of precision. ?̂ = A physical therapist determines that her patient Jan has a range of ankle motion of 7.26°7.26° while barefoot. Predict Jan's range of ankle motion while wearing medical shoes, ?̂ . Round your answer to two decimal places. ?̂ = Suppose Jan's…arrow_forwardData was collected for a regression analysis comparing car weight and fuel consumption. b0 was found to be 32.7, b1 was found to be -7.6, and R2 was found to be 0.86. Interpret the y-intercept of the line. On average, each one unit increase in the weight of a car decreases its ful consumption by 7.6 units. On average, when x=0, a car gets -7.6 miles per gallon. On average, when x=0, a car gets 32.7 miles per gallon. On average, each one unit increase in the weight of a car increases its fuel comsumption by 32.7 units. We should not interpret the y-intercept in this problem.arrow_forward
arrow_back_ios
arrow_forward_ios
Recommended textbooks for you
 MATLAB: An Introduction with ApplicationsStatisticsISBN:9781119256830Author:Amos GilatPublisher:John Wiley & Sons Inc
 Probability and Statistics for Engineering and th...StatisticsISBN:9781305251809Author:Jay L. DevorePublisher:Cengage Learning
 Statistics for The Behavioral Sciences (MindTap C...StatisticsISBN:9781305504912Author:Frederick J Gravetter, Larry B. WallnauPublisher:Cengage Learning
 Elementary Statistics: Picturing the World (7th E...StatisticsISBN:9780134683416Author:Ron Larson, Betsy FarberPublisher:PEARSON
 The Basic Practice of StatisticsStatisticsISBN:9781319042578Author:David S. Moore, William I. Notz, Michael A. FlignerPublisher:W. H. Freeman
 Introduction to the Practice of StatisticsStatisticsISBN:9781319013387Author:David S. Moore, George P. McCabe, Bruce A. CraigPublisher:W. H. Freeman

MATLAB: An Introduction with Applications
Statistics
ISBN:9781119256830
Author:Amos Gilat
Publisher:John Wiley & Sons Inc

Probability and Statistics for Engineering and th...
Statistics
ISBN:9781305251809
Author:Jay L. Devore
Publisher:Cengage Learning

Statistics for The Behavioral Sciences (MindTap C...
Statistics
ISBN:9781305504912
Author:Frederick J Gravetter, Larry B. Wallnau
Publisher:Cengage Learning

Elementary Statistics: Picturing the World (7th E...
Statistics
ISBN:9780134683416
Author:Ron Larson, Betsy Farber
Publisher:PEARSON

The Basic Practice of Statistics
Statistics
ISBN:9781319042578
Author:David S. Moore, William I. Notz, Michael A. Fligner
Publisher:W. H. Freeman

Introduction to the Practice of Statistics
Statistics
ISBN:9781319013387
Author:David S. Moore, George P. McCabe, Bruce A. Craig
Publisher:W. H. Freeman