MATLAB: An Introduction with Applications
6th Edition
ISBN: 9781119256830
Author: Amos Gilat
Publisher: John Wiley & Sons Inc
expand_more
expand_more
format_list_bulleted
Question
Please assist this problem involving hypothesis testing.

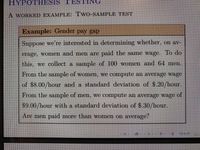
Transcribed Image Text:HYPOTHIESIS TESTING
A WORKED EXAMPLE: TWO-SAMPLE TEST
Example: Gender pay gap
Suppose we're interested in determining whether, on av-
erage, women and men are paid the same wage. To do
this, we collect a sample of 100 women and 64 men.
From the sample of women, we compute an average wage
of $8.00/hour and a standard deviation of $.20/hour.
From the sample of men, we compute an average wage of
$9.00/hour with a standard deviation of $.30/hour.
Are men paid more than women on average?
Expert Solution
This question has been solved!
Explore an expertly crafted, step-by-step solution for a thorough understanding of key concepts.
This is a popular solution
Trending nowThis is a popular solution!
Step by stepSolved in 2 steps with 2 images

Knowledge Booster
Similar questions
- When conducting a hypothesis test, what would it mean if the researcher obtains a negative test statistic? The sample is too small. It’s very unlikely the results would have occurred just by chance alone. The sample statistic is smaller than the claimed population parameter. A mistake was made in terms of calculating the test statistic. The sample statistic is larger than the claimed population parameter.arrow_forwardI don't know where to begin to build a hypothesis Test.arrow_forwardX https://ezto-cf-med X //ezto.mheducation.com/ext/map/index.html?_con=con&external_browser=0&launchUrl=https%253A%252F%252FI... A All menti # Question 1- Ch 9A X Test statistic a-2. Find the p-value. 3 In order to conduct a hypothesis test for the population proportion, you sample 400 observations that result in 140 successes. (You may find it useful to reference the appropriate table: z table or t table) '* He: p≥ 0.36; HA: P wwwmtalk. 144 ( 9 0 K f10 O ➤11 C Sign In or Sign Up | x | + ♡ O A P Help 112 Save & Exit L [ Check my work insert G Submit 4x prt sc backspaarrow_forward
- Please answer the questions in the attatched photo. Thank You!arrow_forwardMany questions in research can be expressed as two competing statements about the population parameter. These two statements are called the null and the alternative hypotheses. Usually, the researcher hopes the sample evidence will be in favor of the alternative hypothesis, the new theory. It is important to be able to state the theories that are being put to a test. Do a minority of Michigan residents clear snow from sidewalks before 9 am after snow has fallen?For this scenario, write out the hypotheses to be put to the test and define the parameter of interest in context of the problem. H0:Ha: The parameter p represents ___(provide appropriate definition in context)________arrow_forwardFor each scenario below read the given null and alternative hypotheses statements as well as the initial decision about the null hypothesis. Post a conclusion about the claim in each test. (This means when you post your answer, you do not need to include any statement about the null hypothesis. Only the final conclusion is needed.) **Chart 1 is attached** 1 Winning team data were collected for teams in different spots. use a .05 level of significance to test the claim that home/visitor wins are independent of the sport. **Table 1 is attached** P-Value=0.762arrow_forward
- Hello, may I get please help with the following? All the questions are provided in the images. Question 1 has the same answer choices for all the boxes. An explanation leading to the CORRECT answers would be helpful please! Thank you!arrow_forwardPlease show the “BELL CURVE” model and any “HYPOTHESIS TEST GRAPH GENERATOR” and “EVERY STEP” you took to solve the problem “WITHOUT TAKING ANY SHORT CUTS” so I can see every step to solve the problem. When short cuts are taken, it is hard to determine what the missing step was.arrow_forwardPlease show a step-by-step solution. Please do not skip steps.arrow_forward
arrow_back_ios
arrow_forward_ios
Recommended textbooks for you
 MATLAB: An Introduction with ApplicationsStatisticsISBN:9781119256830Author:Amos GilatPublisher:John Wiley & Sons Inc
 Probability and Statistics for Engineering and th...StatisticsISBN:9781305251809Author:Jay L. DevorePublisher:Cengage Learning
 Statistics for The Behavioral Sciences (MindTap C...StatisticsISBN:9781305504912Author:Frederick J Gravetter, Larry B. WallnauPublisher:Cengage Learning
 Elementary Statistics: Picturing the World (7th E...StatisticsISBN:9780134683416Author:Ron Larson, Betsy FarberPublisher:PEARSON
 The Basic Practice of StatisticsStatisticsISBN:9781319042578Author:David S. Moore, William I. Notz, Michael A. FlignerPublisher:W. H. Freeman
 Introduction to the Practice of StatisticsStatisticsISBN:9781319013387Author:David S. Moore, George P. McCabe, Bruce A. CraigPublisher:W. H. Freeman

MATLAB: An Introduction with Applications
Statistics
ISBN:9781119256830
Author:Amos Gilat
Publisher:John Wiley & Sons Inc

Probability and Statistics for Engineering and th...
Statistics
ISBN:9781305251809
Author:Jay L. Devore
Publisher:Cengage Learning

Statistics for The Behavioral Sciences (MindTap C...
Statistics
ISBN:9781305504912
Author:Frederick J Gravetter, Larry B. Wallnau
Publisher:Cengage Learning

Elementary Statistics: Picturing the World (7th E...
Statistics
ISBN:9780134683416
Author:Ron Larson, Betsy Farber
Publisher:PEARSON

The Basic Practice of Statistics
Statistics
ISBN:9781319042578
Author:David S. Moore, William I. Notz, Michael A. Fligner
Publisher:W. H. Freeman

Introduction to the Practice of Statistics
Statistics
ISBN:9781319013387
Author:David S. Moore, George P. McCabe, Bruce A. Craig
Publisher:W. H. Freeman