MATLAB: An Introduction with Applications
6th Edition
ISBN: 9781119256830
Author: Amos Gilat
Publisher: John Wiley & Sons Inc
expand_more
expand_more
format_list_bulleted
Question
Hello, may I get please help with the following?
All the questions are provided in the images.
Question 1 has the same answer choices for all the boxes. An explanation leading to the CORRECT answers would be helpful please!
Thank you!

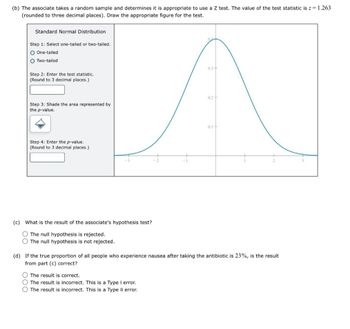
Transcribed Image Text:(b) The associate takes a random sample and determines it is appropriate to use a Z test. The value of the test statistic is z = 1.263
(rounded to three decimal places). Draw the appropriate figure for the test.
Standard Normal Distribution
Step 1: Select one-tailed or two-tailed.
One-tailed
Two-tailed
Step 2: Enter the test statistic.
(Round to 3 decimal places.)
04
0.3-
0.2
Step 3: Shade the area represented by
the p-value.
Step 4: Enter the p-value.
(Round to 3 decimal places.)
0.1+
(c) What is the result of the associate's hypothesis test?
The null hypothesis is rejected.
O The null hypothesis is not rejected.
(d) If the true proportion of all people who experience nausea after taking the antibiotic is 23%, is the result
from part (c) correct?
O The result is correct.
The result is incorrect. This is a Type I error.
The result is incorrect. This is a Type II error.

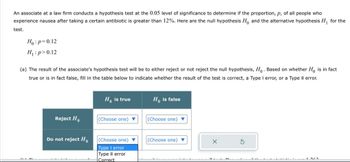
Transcribed Image Text:An associate at a law firm conducts a hypothesis test at the 0.05 level of significance to determine if the proportion, p, of all people who
experience nausea after taking a certain antibiotic is greater than 12%. Here are the null hypothesis Ho, and the alternative hypothesis H₁ for the
test.
Hop-0.12
H₁: p>0.12
(a) The result of the associate's hypothesis test will be to either reject or not reject the null hypothesis, Ho. Based on whether Ho is in fact
true or is in fact false, fill in the table below to indicate whether the result of the test is correct, a Type I error, or a Type II error.
Ho is true
Ho is false
Reject Ho
(Choose one)
(Choose one)
Do not reject Ho(Choose one)
Type I error
Type II error
Correct
(Choose one)
100
Expert Solution
This question has been solved!
Explore an expertly crafted, step-by-step solution for a thorough understanding of key concepts.
This is a popular solution
Trending nowThis is a popular solution!
Step by stepSolved in 2 steps with 1 images

Knowledge Booster
Similar questions
- Please refer to image and answer!arrow_forwardFor each problem, show all work and explain your reasoning.(a) Does the overall configuration consider the order of the individual pieces of the configuration? (b) Count the number of different configurations for the prompt.1. Passwords of length seven containing distinct letters consisting of uppercase English lettersand/or lowercase English letters2. Committees consisting of four folks formed from the 11 Math faculty members3. Usernames of length six consisting of uppercase English letters, lowercase English letters,and/or numbers from 0–94. Election results from 6 Math 150 students for course president, vice president, and treasurer5. Phone numbers containing only odd numbers6. Social security numbers containing neither 8’s nor 9’s7. Ice cream sundaes consisting of three distinct flavors taken from ten total flavors8. Handfuls of five Skittles consisting of only “warm” colors from a jar containing 8 red, 11green, 7 yellow, 12 purple, and 13 orange9. Possible rolls from fair 6-sided,…arrow_forwardWhich two points that Ethan plotted represent numbers that have a sum of 0?Show or explain how you got your answer.arrow_forward
- First picture is the problem and second question is the question to the problem. Please state answer from the drop down choices.arrow_forwardFor each problem, show all work and explain your reasoning.(a) Does the overall configuration consider the order of the individual pieces of the configuration?(b) Count the number of different configurations for the prompt.1. Passwords of length seven containing distinct letters consisting of uppercase English lettersand/or lowercase English letters2. Committees consisting of four folks formed from the 11 Math faculty members3. Usernames of length six consisting of uppercase English letters, lowercase English letters,and/or numbers from 0–94. Election results from 6 Math 150 students for course president, vice president, and treasurer5. Phone numbers containing only odd numbers6. Social security numbers containing neither 8’s nor 9’s7. Ice cream sundaes consisting of three distinct flavors taken from ten total flavors8. Handfuls of five Skittles consisting of only “warm” colors from a jar containing 8 red, 11green, 7 yellow, 12 purple, and 13 orange9. Possible rolls from fair 6-sided,…arrow_forwardWhat would the ordered pair represent in the context of the problem.arrow_forward
arrow_back_ios
arrow_forward_ios
Recommended textbooks for you
 MATLAB: An Introduction with ApplicationsStatisticsISBN:9781119256830Author:Amos GilatPublisher:John Wiley & Sons Inc
 Probability and Statistics for Engineering and th...StatisticsISBN:9781305251809Author:Jay L. DevorePublisher:Cengage Learning
 Statistics for The Behavioral Sciences (MindTap C...StatisticsISBN:9781305504912Author:Frederick J Gravetter, Larry B. WallnauPublisher:Cengage Learning
 Elementary Statistics: Picturing the World (7th E...StatisticsISBN:9780134683416Author:Ron Larson, Betsy FarberPublisher:PEARSON
 The Basic Practice of StatisticsStatisticsISBN:9781319042578Author:David S. Moore, William I. Notz, Michael A. FlignerPublisher:W. H. Freeman
 Introduction to the Practice of StatisticsStatisticsISBN:9781319013387Author:David S. Moore, George P. McCabe, Bruce A. CraigPublisher:W. H. Freeman

MATLAB: An Introduction with Applications
Statistics
ISBN:9781119256830
Author:Amos Gilat
Publisher:John Wiley & Sons Inc

Probability and Statistics for Engineering and th...
Statistics
ISBN:9781305251809
Author:Jay L. Devore
Publisher:Cengage Learning

Statistics for The Behavioral Sciences (MindTap C...
Statistics
ISBN:9781305504912
Author:Frederick J Gravetter, Larry B. Wallnau
Publisher:Cengage Learning

Elementary Statistics: Picturing the World (7th E...
Statistics
ISBN:9780134683416
Author:Ron Larson, Betsy Farber
Publisher:PEARSON

The Basic Practice of Statistics
Statistics
ISBN:9781319042578
Author:David S. Moore, William I. Notz, Michael A. Fligner
Publisher:W. H. Freeman

Introduction to the Practice of Statistics
Statistics
ISBN:9781319013387
Author:David S. Moore, George P. McCabe, Bruce A. Craig
Publisher:W. H. Freeman