
Essentials Of Investments
11th Edition
ISBN: 9781260013924
Author: Bodie, Zvi, Kane, Alex, MARCUS, Alan J.
Publisher: Mcgraw-hill Education,
expand_more
expand_more
format_list_bulleted
Related questions
Question
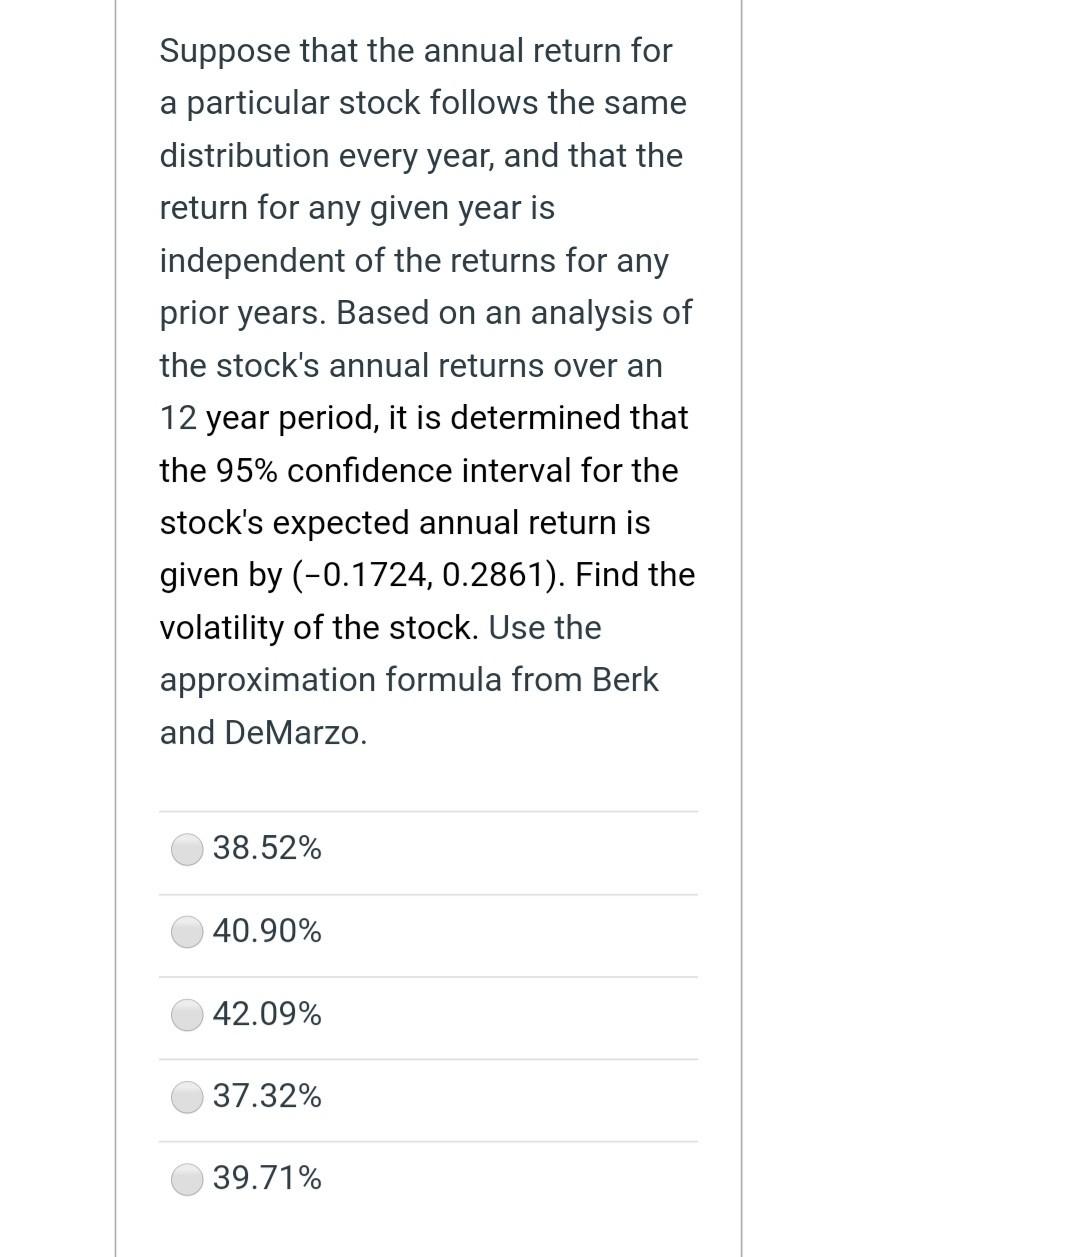

Transcribed Image Text:Suppose that the annual return for
particular stock follows the same
distribution every year, and that the
return for any given year is
independent of the returns for any
prior years. Based on an analysis of
the stock's annual returns over an
12 year period, it is determined that
the 95% confidence interval for the
stock's expected annual return is
given by (-0.1724, 0.2861). Find the
volatility of the stock. Use the
approximation formula from Berk
and DeMarzo.
38.52%
40.90%
42.09%
37.32%
39.71%
Expert Solution
This question has been solved!
Explore an expertly crafted, step-by-step solution for a thorough understanding of key concepts.

This is a popular solution

Trending nowThis is a popular solution!

Step by stepSolved in 5 steps

Knowledge Booster


Learn more about
Need a deep-dive on the concept behind this application? Look no further. Learn more about this topic, finance and related others by exploring similar questions and additional content below.Similar questions
- Suppose you are attempting to value a 1-year expiration option on a stock with volatility (i.e., annualized standard deviation) of σ = 0.34. What would be the appropriate values for u and d if your binomial model is set up using: 1 period of 1 year. 4 subperiods, each 3 months. 12 subperiods, each 1 month.arrow_forwardStock X has a beta of 0.5 and Stock Y has a beta of 1.5. Which of the following statements must be true about these securities. (Assume market equilibrium.) Group of answer choices Stock Y has a higher standard deviation than Stock X. Stock Y's realized return next year will be higher than Stock X's return. If the expected rate of inflation increases but the market risk premium is unchanged, the required returns on the two stocks will increase by the same amount. If you invest $50,000 in each of Stocks X and Y, your 2-stock portfolio will have a beta lower than 1.0. If the market risk premium declines, Stock X will have a larger decline in its required return than Stock Y.arrow_forwardSuppose the average return on Asset A is 6.6 percent and the standard deviation is 8.6 percent and the average return and standard deviation on Asset B are 3.8 percent and 3.2 percent, respectively. Further assume that the returns are normally distributed. Use the NORMDIST function in Excel® to answer the following questions. a. What is the probability that in any given year, the return on Asset A will be greater than 11 percent? Less than 0 percent? (Do not round intermediate calculations and enter your answers as a percent rounded to 2 decimal places, e.g., 32.16.) b. What is the probability that in any given year, the return on Asset B will be greater than 11 percent? Less than 0 percent? (Do not round intermediate calculations and enter your answers as a percent rounded to 2 decimal places, e.g., 32.16.) c-1. In a particular year, the return on Asset A was −4.25 percent. How likely is it that such a low return will recur at some point in the future? (Do…arrow_forward
- Assume the CAPM holds and consider stock X, which has a return variance of 0.09 and a correlation of 0.75 with the market portfolio. The market portfolio's Sharpe ratio is 0.30 and the the risk-free rate is 5%. (a) What is Stock X's expected return? (b) What proportion of Stock X's return volatility (i.e. standard deviation) is priced by the market? Explain why this number is less than 1.arrow_forwardA. If a stock costs $55 one month and drops to $45 the next month, what is the expected stock price the next month, if we assume the stock follows a random walk? B. Explain both technical and fundamental analysis and what form of the efficient market hypothesis corresponds to each.arrow_forwardAssume these are the stock market and Treasury bill returns for a 5-year period: Required: a. What was the risk premium on common stock in each year? b. What was the average risk premium? c. What was the standard deviation of the risk premium? (Ignore that the estimation is from a sample of data.) Complete this question by entering your answers in the tabs below. What was the standard deviation of the risk premium? (Ignore that the estimation is from a sample of data.) Note: Do not round intermediate calculations. Enter your answer as a percent rounded to 2 decimal places.arrow_forward
- You are given the following returns on "the market" and Stock F during the last three years. We could calculate beta using data for Years 1 and 2 and then, after Year 3, calculate a new beta for Years 2 and 3. How different are those two betas, i.e., what's the value of beta 2 - beta 1? (Hint: You can find betas using the Rise-Over-Run method, or using your calculator's regression function.) Year Market Stock F 1 6.10% 19.50% 2 12.90% −3.70% 3 16.20% 21.71% A. 10.96 B. 10.91 C. 11.06 D. 11.01 E. 11.11 Note:- Do not provide handwritten solution. Maintain accuracy and quality in your answer. Take care of plagiarism. Answer completely. You will get up vote for sure.arrow_forwardStock A has expected return of 15% and standard deviation (s.d.) 20%. Stock B has expected return 20% and s.d. 15%. The two stocks have a correlation coefficient of 0.5. a. Note that Stock A has greater risk (s.d.) that Stock B, but a lower expected return. Explain how is this possible in a world where returns on assets are as predicted by the CAPM. The beta of stock A is 1 and the beta of stock B is 1.5. What is the risk premium on the market portfolio, if the CAPM holds ?arrow_forwarduppose the average return on Asset A is 7.1 percent and the standard deviation is 8.3 percent, and the average return and standard deviation on Asset B are 4.2 percent and 3.6 percent, respectively. Further assume that the returns are normally distributed. Use the NORMDIST function in Excel® to answer the following questions. a. What is the probability that in any given year, the return on Asset A will be greater than 12 percent? Less than 0 percent? (Do not round intermediate calculations and enter your answers as a percent rounded to 2 decimal places, e.g., 32.16.) b. What is the probability that in any given year, the return on Asset B will be greater than 12 percent? Less than 0 percent? (Do not round intermediate calculations and enter your answers as a percent rounded to 2 decimal places, e.g., 32.16.) c-1. In a particular year, the return on Asset A was −4.38 percent. How likely is it that such a low return will recur at some point in the future? (Do not round…arrow_forward
- Stocks A and B have the following probability distributions of expected future returns: Probability 0.1 (15%) (31%) 0.1 5 0 0.6 15 18 0.1 0.1 22 31 30 49 a. Calculate the expected rate of return, B, for Stock B (A = 13.30%.) Do not round intermediate calculations. Round your answer to two decimal places. % b. Calculate the standard deviation of expected returns, GA, for Stock A (σ = 19.42%.) Do not round intermediate calculations. Round your answer to two decimal places. % Now calculate the coefficient of variation for Stock B. Do not round intermediate calculations. Round your answer to two decimal places. Is it possible that most investors might regard Stock B as being less risky than Stock A? I. If Stock B is less highly correlated with the market than A, then it might have a higher beta than Stock A, and hence be more risky in a portfolio sense. II. If Stock B is more highly correlated with the market than A, then it might have a higher beta than Stock A, and hence be less risky in…arrow_forwardRemember, the expected value of a probability distribution is a statistical measure of the average (mean) value expected to occur during all possible circumstances. To compute an asset's expected return under a range of possible circumstances (or states of nature), multiply the anticipated return expected to result during each state of nature by its probability of occurrence. Consider the following case: David owns a two-stock portfolio that invests in Falcon Freight Company (FF) and Pheasant Pharmaceuticals (PP). Three-quarters of David's portfolio value consists of FF's shares, and the balance consists of PP's shares. Each stock's expected return for the next year will depend on forecasted market conditions. The expected returns from the stocks in different market conditions are detailed in the following table: Market Condition Probability of Occurrence Falcon Freight Pheasant Pharmaceuticals 0.20 0.35 0.45 Strong Normal Weak 40% 24% -32% 56% 32% -40% Calculate expected returns for…arrow_forwardi need the answer quicklyarrow_forward
arrow_back_ios
SEE MORE QUESTIONS
arrow_forward_ios
Recommended textbooks for you
- Essentials Of InvestmentsFinanceISBN:9781260013924Author:Bodie, Zvi, Kane, Alex, MARCUS, Alan J.Publisher:Mcgraw-hill Education,


 Foundations Of FinanceFinanceISBN:9780134897264Author:KEOWN, Arthur J., Martin, John D., PETTY, J. WilliamPublisher:Pearson,
 Fundamentals of Financial Management (MindTap Cou...FinanceISBN:9781337395250Author:Eugene F. Brigham, Joel F. HoustonPublisher:Cengage Learning
 Corporate Finance (The Mcgraw-hill/Irwin Series i...FinanceISBN:9780077861759Author:Stephen A. Ross Franco Modigliani Professor of Financial Economics Professor, Randolph W Westerfield Robert R. Dockson Deans Chair in Bus. Admin., Jeffrey Jaffe, Bradford D Jordan ProfessorPublisher:McGraw-Hill Education
Essentials Of Investments
Finance
ISBN:9781260013924
Author:Bodie, Zvi, Kane, Alex, MARCUS, Alan J.
Publisher:Mcgraw-hill Education,
Foundations Of Finance
Finance
ISBN:9780134897264
Author:KEOWN, Arthur J., Martin, John D., PETTY, J. William
Publisher:Pearson,
Fundamentals of Financial Management (MindTap Cou...
Finance
ISBN:9781337395250
Author:Eugene F. Brigham, Joel F. Houston
Publisher:Cengage Learning
Corporate Finance (The Mcgraw-hill/Irwin Series i...
Finance
ISBN:9780077861759
Author:Stephen A. Ross Franco Modigliani Professor of Financial Economics Professor, Randolph W Westerfield Robert R. Dockson Deans Chair in Bus. Admin., Jeffrey Jaffe, Bradford D Jordan Professor
Publisher:McGraw-Hill Education