MATLAB: An Introduction with Applications
6th Edition
ISBN: 9781119256830
Author: Amos Gilat
Publisher: John Wiley & Sons Inc
expand_more
expand_more
format_list_bulleted
Concept explainers
Topic Video
Question

Transcribed Image Text:starta
Find o
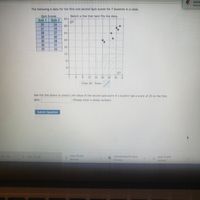
The following is data for the first and second Quiz scores for 7 students in a class.
Quiz Scores
Sketch a line that best fits the data.
32
Q2
28
Quiz 1
Quiz 2
25
24
21
19
28
27
24
20
20
30
28
20
26
21
16
29
26
12
8
4
4
12
16
20
24
28
32
Clear All Draw:
Use the line above to predict the value of the second quiz score if a student had a score of 25 on the first
quiz.
(Please enter a whole number)
Submit Question
30..jpg
2021 02 06
poly (2).pdf
zoomday8sp21.docx
poly (1).pdf
Removed
Removed
Removed
:-
Expert Solution
This question has been solved!
Explore an expertly crafted, step-by-step solution for a thorough understanding of key concepts.
Step by stepSolved in 2 steps with 2 images

Knowledge Booster
Learn more about
Need a deep-dive on the concept behind this application? Look no further. Learn more about this topic, statistics and related others by exploring similar questions and additional content below.Similar questions
- Find Q1, the median, Q3, and the IQR for the data shown below. (Exclude the median from the lower half and from the upper half of the data.) 14 17 18 23 24 48 55 56 68 76 88 Q1 Median= Q3 = IQR = %3Darrow_forwardhe data set below shows the ages of a random sample of children under the age of 14 who live in an apartment uilding. dake a dot plot to display the data. Children's Ages 7,4,7,7,2, 10, 12, 8, 7, 4arrow_forwardA pediatrician wants to determine the relation that may exist between a child's height and head circumference. She randomly selects 8 children from her practice, measures their height and head circumference and obtains the data shown below. Height Head Circumference 27 17.5 25 17 26.5 17.2 25.5 17 27.75 17.4 26.25 17.4 26 17.1 27.25 17.4 data table n 3 0.997 4 0.950 5 0.878 6 0.811 7 0.754 8 0.707 9 0.666 10 0.632 11 0.602 12 0.576 13 0.553 14 0.532 15 0.514 16 0.497 17 0.482 18 0.468 19 0.456 20 0.444 21 0.433 22 0.423 23 0.413 24 0.404 25 0.396 26 0.388 27 0.381 28 0.374 29 0.367 30 0.361 compute the linear correlation coefficient between the height and head circumference of a child. r = ____ (round to three decimal places as…arrow_forward
- Sara creates a box plot using 23,26,44,19,31,39, and 43 . Which one shows the data?arrow_forwardL4Q2.Which one of the following scatter plots best describes the given data?arrow_forwardDraw a scatter plot for the data in the following table. -4 -3 -2 -1 0 1 2 3 4 LO y 0.5 3 4.8 6 7.1 7.2 8.3 8.9 9 9.9 9 8 7 6 5 4 3 21 + -4-3 -2 -1 1 2 3 4 5 Clear All Draw: Dotarrow_forward
- The accompanying table lists the ages of acting award winners matched by the years in which the awards were won. Construct a scatterplot, find the value of the linear correlation coefficient r, and find the P-value of r. Determine whether there is sufficient evidence to support a claim of linear correlation between the two variables. Should we expect that there would be a correlation? Use a significance level of a = 0.01. Click the icon to view the ages of the award winners. Construct a scatterplot. Choose the correct graph below. OA 70- 20- 20 70 Best Actress (years) B. 70- 20- 20 70 Best Actress (years) The linear correlation coefficient is r = (Round to three decimal places as needed.) 70- 20- 20 70 Best Actress (years) Q G D. 70- 20- 20 70 Best Actress (years)arrow_forwardFind the five number summary and draw a box and whisker plot of the data. 4 8 8 6 2 9 8 7 9 6 9 4 2 6 2 9 8 7 7 9arrow_forwardHekp me fasttt also whisker and box plotarrow_forward
arrow_back_ios
arrow_forward_ios
Recommended textbooks for you
 MATLAB: An Introduction with ApplicationsStatisticsISBN:9781119256830Author:Amos GilatPublisher:John Wiley & Sons Inc
 Probability and Statistics for Engineering and th...StatisticsISBN:9781305251809Author:Jay L. DevorePublisher:Cengage Learning
 Statistics for The Behavioral Sciences (MindTap C...StatisticsISBN:9781305504912Author:Frederick J Gravetter, Larry B. WallnauPublisher:Cengage Learning
 Elementary Statistics: Picturing the World (7th E...StatisticsISBN:9780134683416Author:Ron Larson, Betsy FarberPublisher:PEARSON
 The Basic Practice of StatisticsStatisticsISBN:9781319042578Author:David S. Moore, William I. Notz, Michael A. FlignerPublisher:W. H. Freeman
 Introduction to the Practice of StatisticsStatisticsISBN:9781319013387Author:David S. Moore, George P. McCabe, Bruce A. CraigPublisher:W. H. Freeman

MATLAB: An Introduction with Applications
Statistics
ISBN:9781119256830
Author:Amos Gilat
Publisher:John Wiley & Sons Inc

Probability and Statistics for Engineering and th...
Statistics
ISBN:9781305251809
Author:Jay L. Devore
Publisher:Cengage Learning

Statistics for The Behavioral Sciences (MindTap C...
Statistics
ISBN:9781305504912
Author:Frederick J Gravetter, Larry B. Wallnau
Publisher:Cengage Learning

Elementary Statistics: Picturing the World (7th E...
Statistics
ISBN:9780134683416
Author:Ron Larson, Betsy Farber
Publisher:PEARSON

The Basic Practice of Statistics
Statistics
ISBN:9781319042578
Author:David S. Moore, William I. Notz, Michael A. Fligner
Publisher:W. H. Freeman

Introduction to the Practice of Statistics
Statistics
ISBN:9781319013387
Author:David S. Moore, George P. McCabe, Bruce A. Craig
Publisher:W. H. Freeman