
MATLAB: An Introduction with Applications
6th Edition
ISBN: 9781119256830
Author: Amos Gilat
Publisher: John Wiley & Sons Inc
expand_more
expand_more
format_list_bulleted
Related questions
Question
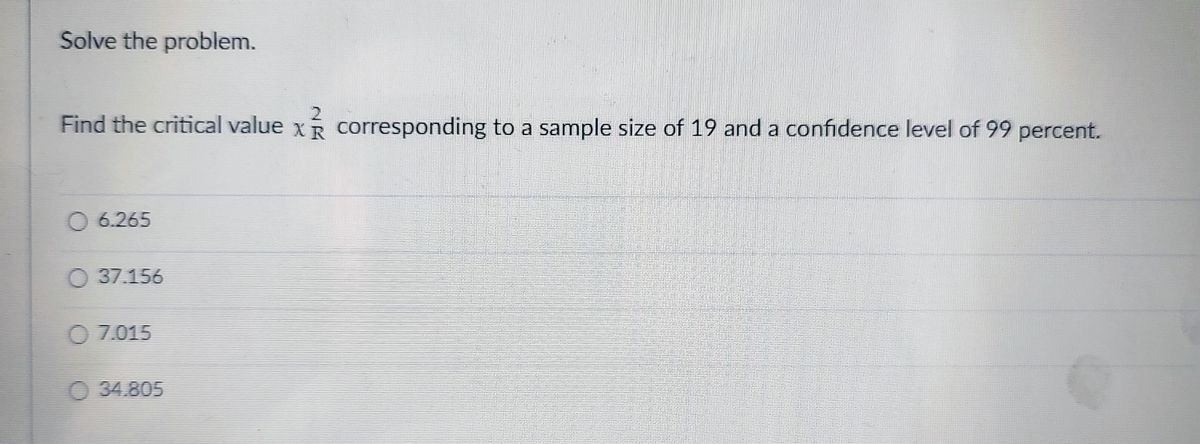

Transcribed Image Text:Solve the problem.
2
Find the critical value x corresponding to a sample size of 19 and a confidence level of 99 percent.
6.265
37.156
O 7.015
34.805
Expert Solution
This question has been solved!
Explore an expertly crafted, step-by-step solution for a thorough understanding of key concepts.

This is a popular solution

Trending nowThis is a popular solution!

Step by stepSolved in 3 steps

Knowledge Booster

Similar questions
- find the sample size needed to estimate the percentage of adults who can wiggle their ears. use a margin of error of 4 percentage and use a confidence level of 95%. complete parts (a) and (b) below. b. assume that 21% of adults can wiggle their ears. b. Assume that 21% of adults can wiggle their earsarrow_forwardTina catches a 14-pound bass. She does not know the population mean or standard deviation. So she takes a sample of five friends and they say the last bass they caught was 9, 12, 13, 10, and 10 pounds. Find the t and calculate a 95% (α = .05) confidence interval.arrow_forwardConstruct the confidence interval for the population mean u .c=.98, x=6.4, o=0.7, n = 40arrow_forward
- Find the sample size needed to estimate the percentage of adults who can wiggle their ears. Use a margin of error of 5 percentage points and use a confidence level of 90%. Complete parts (a) and (b) below. a. Assume that p and q are unknown. n = (Round up to the nearest integer.)arrow_forwardUse the given confidence interval to find the margin of error and the sample proportion. (0.740,0.766) E=enter your response here (Type an integer or a decimal.)arrow_forwardPlease answer with explanation.arrow_forward
- What is one property of a stationary time series? Question 23 options: The datapoints demonstrate a clear seasonal pattern The mean remains constant over time It is plotted as a straight horizontal line It demonstrates an upward trendarrow_forwardUse the given confidence interval to find the margin of error and the sample proportion. (0.760,0.786) E = (Type an integer or a decimal.) (Type an integer or a decimal.) p =arrow_forward25. See photoarrow_forward
- Determine whether the following statements are True or False: If we increase the confidence level C, then the width of the CI decreases, i.e., the CI becomes narrower. (Hint: think about what happens to the margin of error m) Suppose the mean of a population µ = 100. If we found that the margin of error is m = 2 for level of confidence 98%, then we can be 98% confident that a sample mean (computed from a sample of the same size used to compute m) is in the interval (98, 102).arrow_forwardResearchers studied the mean egg length (in millimeters) for a bird population. After taking a random sample of eggs, they obtained a 95% confidence interval of (45,60). What is the value of the margin of error? Choose the correct answer below. A. 15 mm B. 52.5 mm O c. 7.5 mm O D. 1.96arrow_forwardA baseball team claims that the mean length of its games is more than 1.4 hours. State H0 and Ha in words and in symbols. Then determine whether the hypothesis test for this claim is left-tailed, right-tailed, or two-tailed. Explain your reasoning. State the null hypothesis in words and in symbols. Choose the correct answer below. A. The null hypothesis expressed in words is, "the mean length of a baseball team's games is not 1.4 hours." The null hypothesis is expressed symbolically as, "H0: μ≠1.4." B. The null hypothesis expressed in words is, "the mean length of a baseball team's games is at least 1.4 hours." The null hypothesis is expressed symbolically as, "H0: μ≥1.4." C. The null hypothesis expressed in words is, "the mean length of a baseball team's games is at most 1.4 hours." The null hypothesis is expressed symbolically as, "H0: μ≤1.4." D. The null hypothesis expressed in words is, "the mean length of a…arrow_forward
arrow_back_ios
arrow_forward_ios
Recommended textbooks for you
- MATLAB: An Introduction with ApplicationsStatisticsISBN:9781119256830Author:Amos GilatPublisher:John Wiley & Sons Inc
 Probability and Statistics for Engineering and th...StatisticsISBN:9781305251809Author:Jay L. DevorePublisher:Cengage Learning
 Statistics for The Behavioral Sciences (MindTap C...StatisticsISBN:9781305504912Author:Frederick J Gravetter, Larry B. WallnauPublisher:Cengage Learning
  Elementary Statistics: Picturing the World (7th E...StatisticsISBN:9780134683416Author:Ron Larson, Betsy FarberPublisher:PEARSON
 The Basic Practice of StatisticsStatisticsISBN:9781319042578Author:David S. Moore, William I. Notz, Michael A. FlignerPublisher:W. H. Freeman
 Introduction to the Practice of StatisticsStatisticsISBN:9781319013387Author:David S. Moore, George P. McCabe, Bruce A. CraigPublisher:W. H. Freeman
MATLAB: An Introduction with Applications
Statistics
ISBN:9781119256830
Author:Amos Gilat
Publisher:John Wiley & Sons Inc
Probability and Statistics for Engineering and th...
Statistics
ISBN:9781305251809
Author:Jay L. Devore
Publisher:Cengage Learning
Statistics for The Behavioral Sciences (MindTap C...
Statistics
ISBN:9781305504912
Author:Frederick J Gravetter, Larry B. Wallnau
Publisher:Cengage Learning
Elementary Statistics: Picturing the World (7th E...
Statistics
ISBN:9780134683416
Author:Ron Larson, Betsy Farber
Publisher:PEARSON
The Basic Practice of Statistics
Statistics
ISBN:9781319042578
Author:David S. Moore, William I. Notz, Michael A. Fligner
Publisher:W. H. Freeman
Introduction to the Practice of Statistics
Statistics
ISBN:9781319013387
Author:David S. Moore, George P. McCabe, Bruce A. Craig
Publisher:W. H. Freeman