
MATLAB: An Introduction with Applications
6th Edition
ISBN: 9781119256830
Author: Amos Gilat
Publisher: John Wiley & Sons Inc
expand_more
expand_more
format_list_bulleted
Related questions
Question
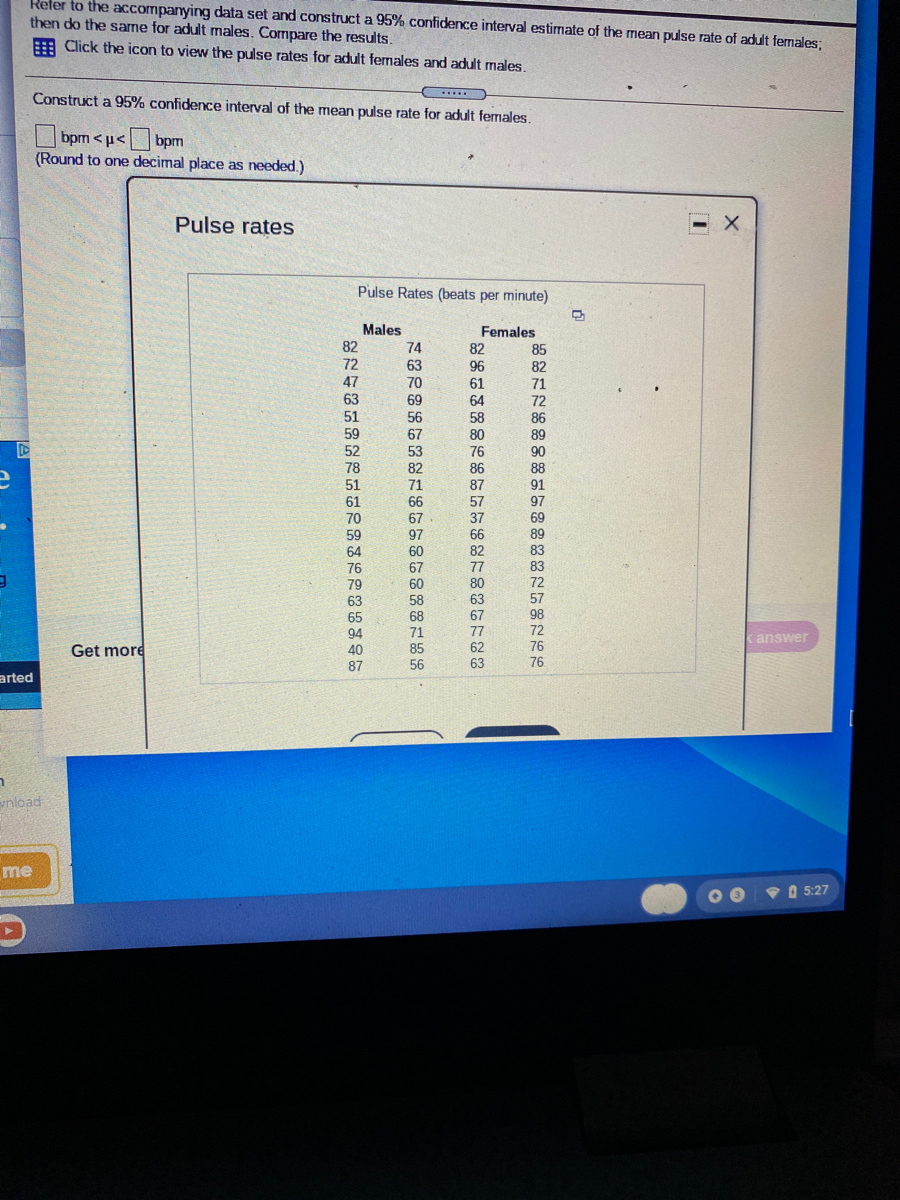

Transcribed Image Text:Refer to the accompanying data set and construct a 95% confidence interval estimate of the mean pulse rate of adult fermales;
then do the same for adult males. Compare the results.
E Click the icon to view the pulse rates for adult fermales and adult males.
Construct a 95% confidence interval of the mean pulse rate for adult fermales.
.....
bpm < µ<bpm
(Round to one decimal place as needed.)
Pulse rates
- X
Pulse Rates (beats per minute)
Males
Females
82
82
74
85
72
63
96
82
47
70
61
71
63
69
64
72
51
56
58
86
59
67
80
89
52
53
76
90
78
82
71
86
87
88
91
51
61
66
57
37
97
70
59
69
89
67
97
66
82
64
60
83
83
67
60
76
77
79
80
72
63
58
63
57
68
67
98
65
94
40
71
77
72
canswer
Get more
85
56
62
76
87
63
76
arted
nload
me
VO 5:27
Expert Solution
This question has been solved!
Explore an expertly crafted, step-by-step solution for a thorough understanding of key concepts.

This is a popular solution

Trending nowThis is a popular solution!

Step by stepSolved in 2 steps with 5 images

Knowledge Booster

Similar questions
- A confidence interval for a population mean estimates the population range estimates likelihood or probability estimates a likely interval for a population mean estimates the population standard deviationarrow_forwardAnswer pleasearrow_forwardproportions #6 If n = 320 and X = 256, construct a 90% confidence interval for the population proportion, p.Give your answers to three decimals < p <arrow_forward
- also need to know whether to reject to fail to reject and the concldecisionarrow_forwardYou measure 20 backpacks' weights, and find they have a mean weight of 80 ounces. Assume the population standard deviation is 11.4 ounces. Based on this, construct a 90% confidence interval for the true population mean backpack weight.Give your answers as decimals, to two places ________±____________ ouncesarrow_forwardConfidence Interval (Breaking Distance of Cars) Please collect the data and draw your assumptions. Using the raw data select the sample that represents the breaking distance of specific cars. Let X represent the number of cars whose breaking distance was less than 130 feet. Use this information to find the confidence interval for the percentage of cars whose breaking distance is less than 130 feet. n = ____________ x = ____________ State your assumption: In words, define the random variable (sample proportion). State the estimated distribution to use. Find the Error and Confidence Interval How much area is in both tails (combined)? α = _____ How much area is in each tail? α/2 = _____ What is z?2 = Construct the interval: Error: _____ Confidence Interval: _____ Fill in the blanks on the graph with the area in each section. Then, fill in the number line with the upper and lower limits of the confidence interval and the sample proportion. 10. Fill…arrow_forward
- What happens to the width of a confidence interval as we increase confidence level, i.e as we increase the confidence from 90% to 95%? The width decreases The width increases The width is not affected by the confidence level The standard deviation increasesarrow_forwardPlz help asap 3.arrow_forwardI need the answer please. Thank youarrow_forward
- Variability Jason and Eric had the same grade for the first nine weeks. The standard deviation of Jason's grades is 20.7 points, while the standard deviation of Eric's grades is 2.7. Which statement must be true? Select one: O a. In general, Eric's grades were lower than Jason's grades. O b. Eric's grades were more consistent than Jason's grades. c. Eric had more failing grades during the marking period than Jason had. O d. The median for Eric's grades is lower than the median for Jason's grades.arrow_forwardAnswer the questionarrow_forwardUse the normal distribution of IQ scores, which has a mean of 85 and a standard deviation of 19, and the following table with the standard scores and percentiles for a normal distribution to find the indicated quantity. The percentage of scores between 75.5 and 132.5 is__% (round two decimal places as needed)arrow_forward
arrow_back_ios
SEE MORE QUESTIONS
arrow_forward_ios
Recommended textbooks for you
- MATLAB: An Introduction with ApplicationsStatisticsISBN:9781119256830Author:Amos GilatPublisher:John Wiley & Sons Inc
 Probability and Statistics for Engineering and th...StatisticsISBN:9781305251809Author:Jay L. DevorePublisher:Cengage Learning
 Statistics for The Behavioral Sciences (MindTap C...StatisticsISBN:9781305504912Author:Frederick J Gravetter, Larry B. WallnauPublisher:Cengage Learning
  Elementary Statistics: Picturing the World (7th E...StatisticsISBN:9780134683416Author:Ron Larson, Betsy FarberPublisher:PEARSON
 The Basic Practice of StatisticsStatisticsISBN:9781319042578Author:David S. Moore, William I. Notz, Michael A. FlignerPublisher:W. H. Freeman
 Introduction to the Practice of StatisticsStatisticsISBN:9781319013387Author:David S. Moore, George P. McCabe, Bruce A. CraigPublisher:W. H. Freeman
MATLAB: An Introduction with Applications
Statistics
ISBN:9781119256830
Author:Amos Gilat
Publisher:John Wiley & Sons Inc
Probability and Statistics for Engineering and th...
Statistics
ISBN:9781305251809
Author:Jay L. Devore
Publisher:Cengage Learning
Statistics for The Behavioral Sciences (MindTap C...
Statistics
ISBN:9781305504912
Author:Frederick J Gravetter, Larry B. Wallnau
Publisher:Cengage Learning
Elementary Statistics: Picturing the World (7th E...
Statistics
ISBN:9780134683416
Author:Ron Larson, Betsy Farber
Publisher:PEARSON
The Basic Practice of Statistics
Statistics
ISBN:9781319042578
Author:David S. Moore, William I. Notz, Michael A. Fligner
Publisher:W. H. Freeman
Introduction to the Practice of Statistics
Statistics
ISBN:9781319013387
Author:David S. Moore, George P. McCabe, Bruce A. Craig
Publisher:W. H. Freeman