
MATLAB: An Introduction with Applications
6th Edition
ISBN: 9781119256830
Author: Amos Gilat
Publisher: John Wiley & Sons Inc
expand_more
expand_more
format_list_bulleted
Related questions
Concept explainers
Topic Video
Question
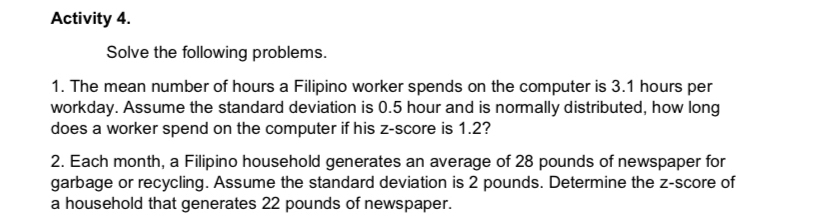

Transcribed Image Text:Activity 4.
Solve the following problems.
1. The mean number of hours a Filipino worker spends on the computer is 3.1 hours per
workday. Assume the standard deviation is 0.5 hour and is normally distributed, how long
does a worker spend on the computer if his z-score is 1.2?
2. Each month, a Filipino household generates an average of 28 pounds of newspaper for
garbage or recycling. Assume the standard deviation is 2 pounds. Determine the z-score of
a household that generates 22 pounds of newspaper.
Expert Solution
This question has been solved!
Explore an expertly crafted, step-by-step solution for a thorough understanding of key concepts.

This is a popular solution

Trending nowThis is a popular solution!

Step by stepSolved in 2 steps

Knowledge Booster


Learn more about
Need a deep-dive on the concept behind this application? Look no further. Learn more about this topic, statistics and related others by exploring similar questions and additional content below.Similar questions
- The picture has the questionarrow_forwardLaura and learn that her GPA average in her school is a 3.6 with a standard deviation of 0.3. if her gpa 3.0 what is her z sxorearrow_forwardWhich statement below is correct? a. Standard deviation should be used when calculating z for a single score, while standard error should be used when calculating z for a sample mean. b. When calculating z for a single score or for a sample mean, the standard error should be used. c. Standard error should be used when calculating z for a single score, while standard deviation should be used when calculating z for a sample mean. d. When calculating z for a single score or for a sample mean, the standard deviation should be used.arrow_forward
- Exhibit 6-5The weight of items produced by a machine is normally distributed with a mean of 8 ounces and a standard deviation of 2 ounces. Refer to Exhibit 6-5. What percentage of items will weigh between 6.4 and 8.9 ounces?arrow_forwardSuppose that the distance of fly balls hit to the outfield (in baseball) is normally distributed with a mean of 250 feet and a standard deviation of 44 feet. Let X = distance in feet for a fly ball. Find the 80th percentile of the distribution of fly balls. (Round your answer to one decimal place.)arrow_forwardA successful basketball player has a height of 6 feet 11 inches, or 211 cm. Based on statistics from a data set, his height converts to the z score of 5.17. How many standard deviations is his height above the mean?arrow_forward
- Ms. Gonzalez has recorded the test scores for each of her 25 students, She has calculated EX? = 320 and (EX) = 5,000, Calculate the estimated population standard deviation for her data. 1.98 2.24 O 5.00 O 3.95arrow_forwardThe serum cholesterol levels for men in one age group are normally distributed with a mean of 178.1 and a standard deviation 40.5. All units are in mg/10 mL. Find the 40th The annual precipitation for one city is normally distributed with a mean of 26.8 inches and a standard deviation of 3.2 inches. What precipitation amounts will contain 99.7% of the observations?arrow_forwardThe mean score for first exam in your first organic chemistry class (section A) was 60, with a standard deviation of 5. Your score on the exam was 70. A. How many standard deviations above the mean is your score?arrow_forward
- A data set lists weights (Ib) of plastic discarded by households. The highest weight is 5.72 Ib, the mean of all of the weights is x= 2.345 lb, and the standard deviation of the weights is s =2.123 lb. a. What is the difference between the weight of 5.72 lb and the mean of the weights? b. How many standard deviations is that (the difference found in part (a))? c. Convert the weight of 5.72 Ib to a z score d. If we consider weights that convert to z scores between -2 and 2 to be neither significantly low nor significantly high, is the weight of 5.72 Ib significant? a. The difference is lb. (Type an integer or a decimal. Do not round.) b. The difference is standard deviations. (Round to two decimal places as needed.) c. The z score is z= (Round to two decimal places as needed.) d. The highest weight isarrow_forwarda quantitative data set has mean 25 and standard deviation 5. what percentage of the observations lie between 15 and 35arrow_forward5. The average weight of a newborn baby is 7.5 lbs with a standard deviation of 1.25 lbs. The average weight of a newborn elephant is 244 lbs with a standard deviation of 15 lbs. Find the Coefficient of Variation for the baby and the elephant. What does the information tell you?arrow_forward
arrow_back_ios
SEE MORE QUESTIONS
arrow_forward_ios
Recommended textbooks for you
- MATLAB: An Introduction with ApplicationsStatisticsISBN:9781119256830Author:Amos GilatPublisher:John Wiley & Sons Inc
 Probability and Statistics for Engineering and th...StatisticsISBN:9781305251809Author:Jay L. DevorePublisher:Cengage Learning
 Statistics for The Behavioral Sciences (MindTap C...StatisticsISBN:9781305504912Author:Frederick J Gravetter, Larry B. WallnauPublisher:Cengage Learning
  Elementary Statistics: Picturing the World (7th E...StatisticsISBN:9780134683416Author:Ron Larson, Betsy FarberPublisher:PEARSON
 The Basic Practice of StatisticsStatisticsISBN:9781319042578Author:David S. Moore, William I. Notz, Michael A. FlignerPublisher:W. H. Freeman
 Introduction to the Practice of StatisticsStatisticsISBN:9781319013387Author:David S. Moore, George P. McCabe, Bruce A. CraigPublisher:W. H. Freeman
MATLAB: An Introduction with Applications
Statistics
ISBN:9781119256830
Author:Amos Gilat
Publisher:John Wiley & Sons Inc
Probability and Statistics for Engineering and th...
Statistics
ISBN:9781305251809
Author:Jay L. Devore
Publisher:Cengage Learning
Statistics for The Behavioral Sciences (MindTap C...
Statistics
ISBN:9781305504912
Author:Frederick J Gravetter, Larry B. Wallnau
Publisher:Cengage Learning
Elementary Statistics: Picturing the World (7th E...
Statistics
ISBN:9780134683416
Author:Ron Larson, Betsy Farber
Publisher:PEARSON
The Basic Practice of Statistics
Statistics
ISBN:9781319042578
Author:David S. Moore, William I. Notz, Michael A. Fligner
Publisher:W. H. Freeman
Introduction to the Practice of Statistics
Statistics
ISBN:9781319013387
Author:David S. Moore, George P. McCabe, Bruce A. Craig
Publisher:W. H. Freeman