FINANCIAL ACCOUNTING
10th Edition
ISBN: 9781259964947
Author: Libby
Publisher: MCG
expand_more
expand_more
format_list_bulleted
Question
thumb_up100%


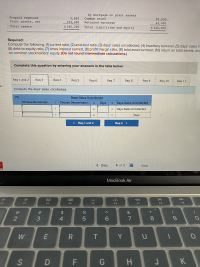
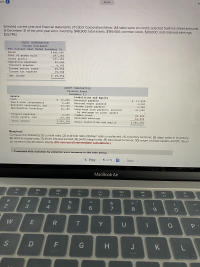
Transcribed Image Text:Selected current year-end financial statements of Cabot Corporation follow. (All sales were on credit; selected balance sheet amounts
at December 31 of the prior year were inventory, $48,900; total assets, $189,400; common stock, $90,000; and retained earnings,
$33,748.)
CABOT CORPORATION
Income Statement
For Current Year Ended December 31
Sales
$ 448,600
297,250
151,350
Cost of goods sold
Gross profit
Operating expenses
Interest expense
98,600
4,100
Income before taxes
48,650
19,598
Income tax expense
Net income
$ 29,052
Expert Solution
This question has been solved!
Explore an expertly crafted, step-by-step solution for a thorough understanding of key concepts.
This is a popular solution
Trending nowThis is a popular solution!
Step by stepSolved in 10 steps

Knowledge Booster
Learn more about
Need a deep-dive on the concept behind this application? Look no further. Learn more about this topic, accounting and related others by exploring similar questions and additional content below.Similar questions
- Multiple-Step Income Statement and Report Form of Balance Sheet The following selected accounts and their current balances appear in the ledger of Prescott Inc. for the fiscal year ended September 30, 20Y8: Cash $187,875 Retained Earnings (as of Sept. 30, 20Y7) $ 571,050 Accounts Receivable 337,500 Dividends 281,250 Inventory 850,500 Sales 8,025,750 Estimated Returns Inventory 78,750 Cost of Goods Sold 4,893,750 Office Supplies 33,750 Sales Salaries Expense 874,800 Prepaid Insurance 27,000 Advertising Expense 103,275 Office Equipment 259,200 Depreciation Expense— Store Equipment 18,675 Accumulated Depreciation— Office Equipment 111,375 Miscellaneous Selling Expense 4,500 Store Equipment 1,150,875 Office Salaries Expense 174,150 Accumulated Depreciation— Store Equipment 420,075 Rent Expense 89,775 Accounts Payable 109,350 Insurance Expense 51,638 Customer Refunds Payable…arrow_forwardSelected current year-end financial statements of Cabot Corporation follow. (All sales were on credit; selected balance sheet amounts at December 31 of the prior year were inventory, $46,900; total assets, $179,400; common stock, $88,000; and retained earnings, $31,286.) Assets Cash Short-term investments Accounts receivable, net Merchandise inventory Prepaid expenses Plant assets, net Total assets CABOT CORPORATION Income Statement Cost of goods sold Gross profit For Current Year Ended December 31 Sales Operating expenses Interest expense Income before taxes Income tax expense Net income $ 18,000 9,000 33,800 Req 1 and 2 Reg 3 Req 4 Compute the debt-to-equity ratio. Numerator: $ 455,600 298,150 157,450 98,500 4,000 54,950 22,136 $ 32,814 30,150 3,050 154,300 Retained earnings $ 248,300 Total liabilities and equity 1 CABOT CORPORATION Balance Sheet December 31 of current year Liabilities and Equity Accounts payable Accrued wages payable Income taxes payable Complete this question by…arrow_forward23arrow_forward
- [The following information applies to the questions displayed below.] Selected comparative financial statements of Korbin Company follow. KORBIN COMPANY Comparative Income Statements For Years Ended December 31 Sales. Cost of goods sold Gross profit Selling expenses Administrative expenses Total expenses Income before taxes Income tax expense Net income Assets Current assets Long-term investments. Plant assets, net Total assets Liabilities and Equity Current liabilities KORBIN COMPANY Comparative Balance Sheets 2020 2021 $548,688 $ 420,340 330,310 263,974 218,378 156,366 77,914 58,007 49,382 36,990 127,296 94,997 91,082 61,369 16,941 12,581 $ 74,141 $ 48,788 Common stock Other paid-in capital Retained earnings Sales Cost of goods sold Gross profit Selling expenses Administrative expenses Total expenses Income before taxes Income tax expense Net income December 31 2021 $ 62,574 % 0 % $ 41,881 $ 55,985 1,200 3,920 114,438 103,962 61,920 $177,012 $ 147,043 $ 121,825 $ 25,844 65,000 8,125…arrow_forwardRatio Analysis of Comparative Financial Statements Amounts from the comparative income statement and balance sheet of Miller Electronics Corporation for the last two years are as follows: Miller Electronics CorporationComparative Income StatementFor Years Ended December 31, 20-2 and 20-1 20-2 20-1 Net Sales (all on account) $643,800 $415,800 Cost of goods sold 387,260 254,650 Gross profit $256,540 $161,150 Administrative expenses $63,715 $41,626 Selling expenses 66,780 44,317 Total operating expenses $130,495 $85,943 Operating income $126,045 $75,207 Interest expense 1,316 1,241 Income before income taxes $124,729 $73,966 Income tax expense 30,895 13,143 Net income $93,834 $60,823 Miller Electronics CorporationComparative Balance SheetDecember 31, 20-2 and 20-1 20-2 20-1 Assets Current assets: Cash $42,848…arrow_forwardHorizontal Analysis of the Income Statement Income statement data for Winthrop Company for two recent years ended December 31 are as follows: Current Year Previous Year Sales $660,000 $500,000 Cost of merchandise sold 554,700 430,000 Gross profit $105,300 $70,000 Selling expenses $31,720 $26,000 Administrative expenses 28,600 22,000 Total operating expenses $60,320 $48,000 Income before income tax expense $44,980 $22,000 Income tax expenses 18,000 8,800 Net income $26,980 $13,200arrow_forward
- Here are simplified financial statements for Watervan Corporation: INCOME STATEMENT (Figures in $ millions) Net sales $ 887.00 Cost of goods sold 747.00 Depreciation 37.00 Earnings before interest and taxes (EBIT) $ 103.00 Interest expense 18.00 Income before tax $ 85.00 Taxes 17.85 Net income $ 67.15 BALANCE SHEET (Figures in $ millions) End of Year Start of Year Assets Current assets $ 375 $ 324 Long-term assets 270 228 Total assets $ 645 $ 552 Liabilities and shareholders’ equity Current liabilities $ 200 $ 163 Long-term debt 114 127 Shareholders’ equity 331 262 Total liabilities and shareholders’ equity $ 645 $ 552 The company’s cost of capital is 8.5%. Required: What is the company’s return on capital? (Use start-of-year rather than average capital.) Note: Do not round intermediate calculations. Enter your answer as a percent rounded to 2 decimal places. P.S- Answer is not 26.48%arrow_forwardCondensed financial data are presented below for the Tulsa Corporation: Accounts receivable Inventory C. d. Total current assets Total assets Current liabilities Long-term liabilities Sales Cost of goods sold Interest expense Net income Tax rate 2021 $277,500 310,000 675,000 800,000 700,000 250,000 200,000 77,500 75,000 1,640,000 985,000 10,000 130,000 25% 2020 $230,000 250,000 565,000 The profit margin used to calculate return on assets for 2021 is (rounded): a. b. 8.9% 16.3% 17.2% 18.3%arrow_forwardFollowing is an incomplete current-year income statement. Determine Net Sales, Cost of goods sold and Net Income. Additional information follows: Return on total assets is 16% (average total assets is $62,500). Inventory turnover is 5 (average inventory is $7,800). Accounts receivable turnover is 8 (average accounts receivable is $7,700). Income Statement Net Sales Cost of goods sold Selling, general, and administrative expenses 8800 Income tax expenses 3800 Net Incomearrow_forward
- Computing Earnings per Share The income statement, statement of retained earnings, and balance sheet for Jeanette Company are as follows: Jeanette CompanyIncome StatementFor the Year Ended December 31, 20X2 Amount Percent Net sales $8,281,989 100.0% Less: Cost of goods sold (5,383,293) 65.0 Gross margin $2,898,696 35.0 Less: Operating expenses (1,323,368) 16.0 Operating income $1,575,328 19.0 Less: Interest expense (50,000) 0.6 Income before taxes $1,525,328 18.4 Less: Income taxes (40%)* (610,131) 7.4 Net income $915,197 11.0 * Includes both state and federal taxes. Jeanette CompanyStatement of Retained EarningsFor the Year Ended December 31, 20X2 Balance, beginning of period $1,979,155 Net income 915,197 Total $2,894,352 Preferred dividends (80,000) Dividends to common stockholders (201,887) Balance, end of period $2,612,465 Jeanette CompanyComparative Balance SheetsAt December 31,…arrow_forwardSimon Company's year-end balance sheets follow. At December 31 Assets Cash Accounts receivable, net Merchandise inventory Prepaid expenses Plant assets, net Total assets Liabilities and Equity Accounts payable Long-term notes payable Common stock, $10 par value Retained earnings Total liabilities and equity For Year Ended December 31 Sales Cost of goods sold Other operating expenses Current Year $ 31,800 89,500 112,500. 10,700 278,500 $ 523,000 Interest expense Income tax expense Total costs and expenses Net income. Earnings per share $ 129,900 98,500 163,500 131,100 $ 523,000 Current Year $ 411,225 209,550 1 Year Ago $ 35,625 62,500 82,500 9,375 255,000 $ 445,000 The company's income statements for the current year and one year ago follow. Assume that all sales are on credit: 4 12,100 9,525 $ 75,250 101,500 163,500 104,750 $ 445,000 $ 673,500 2 Years Ago 642,400 $ 31,100 $ 1.90 $ 37,800 50,200 54,000 5,000 230,500 $ 377,500 $51,250 83,500 163,500 79,250 $ 377,500 1 Year Ago $ 345,500…arrow_forwardCABOT CORPORATION Income Statement For Current Year Ended December 31 Sales $ 448,600 297,150 151,450 98,600 5,000 47,850 19,276 $ 28,574 Cost of goods sold Gross profit Operating expenses Interest expense Profit before taxes Income tax expense Net profit Assets Cash Short-term investments Accounts receivable, net Merchandise inventory Prepaid expenses Property, plant and equipment, net Total assets Req 1 and 2 Req 3 Req 4 CABOT CORPORATION Balance Sheet December 31 Liabilities and Equity Req 5 8,000 Accounts payable 8,800 Accrued wages payable 32,400 Income taxes payable 2,750 Share capital 150,300 Retained earnings $ 238,400 Total liabilities and equity Complete this question by entering your answers in the tabs below. Compute the current ratio and acid-test ratio. 36,150 Long-term note payable, secured by mortgage on property, plant and equipment Required: Compute the following: (1) current ratio, (2) acid-test ratio, (3) days' sales uncollected, (4) inventory turnover, (5) days'…arrow_forward
arrow_back_ios
SEE MORE QUESTIONS
arrow_forward_ios
Recommended textbooks for you

 AccountingAccountingISBN:9781337272094Author:WARREN, Carl S., Reeve, James M., Duchac, Jonathan E.Publisher:Cengage Learning,
 Accounting Information SystemsAccountingISBN:9781337619202Author:Hall, James A.Publisher:Cengage Learning,
 Horngren's Cost Accounting: A Managerial Emphasis...AccountingISBN:9780134475585Author:Srikant M. Datar, Madhav V. RajanPublisher:PEARSON
 Intermediate AccountingAccountingISBN:9781259722660Author:J. David Spiceland, Mark W. Nelson, Wayne M ThomasPublisher:McGraw-Hill Education
 Financial and Managerial AccountingAccountingISBN:9781259726705Author:John J Wild, Ken W. Shaw, Barbara Chiappetta Fundamental Accounting PrinciplesPublisher:McGraw-Hill Education


Accounting
Accounting
ISBN:9781337272094
Author:WARREN, Carl S., Reeve, James M., Duchac, Jonathan E.
Publisher:Cengage Learning,

Accounting Information Systems
Accounting
ISBN:9781337619202
Author:Hall, James A.
Publisher:Cengage Learning,

Horngren's Cost Accounting: A Managerial Emphasis...
Accounting
ISBN:9780134475585
Author:Srikant M. Datar, Madhav V. Rajan
Publisher:PEARSON

Intermediate Accounting
Accounting
ISBN:9781259722660
Author:J. David Spiceland, Mark W. Nelson, Wayne M Thomas
Publisher:McGraw-Hill Education

Financial and Managerial Accounting
Accounting
ISBN:9781259726705
Author:John J Wild, Ken W. Shaw, Barbara Chiappetta Fundamental Accounting Principles
Publisher:McGraw-Hill Education