MATLAB: An Introduction with Applications
6th Edition
ISBN: 9781119256830
Author: Amos Gilat
Publisher: John Wiley & Sons Inc
expand_more
expand_more
format_list_bulleted
Question

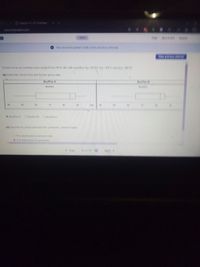
Transcribed Image Text:Question 13-8-1Final Ecam
ezto.mhaducatien.com
Hele ev#E H
aved
You received partial credit in the previous attempt
Scores on an accounting exam ranged from 44 to 96, with quartiles Q1=6000, Q2= 84 5, and Qg- 88 50
(a) Select the correct box plot for the given data
BoxPlot A
BoxPiot B
BaxPlot
BosPlel
40
50
60
70
80
0
100
40
50
BoxPlot A
O BoxPlot B
O BoxPlot C
(b) Describe its shape (skewed left, symmetric, skewed right)
OThe distribution is skewed right.
The distribution is symmetric
( Prev
13 of 19
Nagy
Expert Solution
This question has been solved!
Explore an expertly crafted, step-by-step solution for a thorough understanding of key concepts.
This is a popular solution
Trending nowThis is a popular solution!
Step by stepSolved in 2 steps with 2 images

Knowledge Booster
Similar questions
- 1)Dataset: 88 123 47 45 66 190 157 91 2) Using the dataset from Question #1, what is the median (Round your answer to the one decimal place)?arrow_forwardDescribe the shape of the data presented: 40.0% 35.0% 30.0% 25.0% 20.0% 15.0% 10.0% 5.0% 0.0% 36.1% 24.5% Ethnicity of Students Skewed to the right Skewed to the left Symmetric None of the above 17.1% 9.6% Asian White Hispanic Other/ Unknown 5.8% 5.3% Black Filipino 1.0% 0.6% Pacific Native Islander Americanarrow_forwardScores on an accounting exam ranged from 44 to 92, with quartiles Q1 = 49.50, Q2 = 67.5, and Q3 = 71.00. (a) Select the correct box plot for the given data. BoxPlot A BoxPlot B BoxPlot C multiple choice 1 BoxPlot A BoxPlot B BoxPlot C (b) Describe its shape (skewed left, symmetric, skewed right). multiple choice 2 The distribution is skewed right. The distribution is symmetric. The distribution is skewed left.arrow_forward
- 25 of 30 The following graph shows the mean change in mass of two groups of animals fed on different diets over a period of 2 years: Time course of mass change 275 250 225 200 175 150 125 100 0 3 69 12 15 18 21 24 Time (months) Which of these is the most misleading property of this graph? OThe errors vary between data points. O A best fit curve wasn't shown The interpolating lines have different styles. False zero None of these is relevant to this graph. Mass (g) HH H HH HH HHarrow_forwardScores on an accounting exam ranged from 53 to 92, with quartiles Q1 = 56.75, Q2 = 60.5, and Q3 = 79.75.(a) Select the correct box plot for the given data.BoxPlot A BoxPlot B BoxPlot Cmultiple choice 1BoxPlot ABoxPlot BBoxPlot C (b) Describe its shape (skewed left, symmetric, skewed right).multiple choice 2The distribution is symmetric.The distribution is skewed left.The distribution is skewed right.arrow_forwardBased on the box plot, what are the range and ther interquartile range?arrow_forward
- The following data are the maximum temperatures (in degrees Fahrenheit) of 17 cities in the United states measured on the same day. 53 70 65 74 85 76 84 70 61 59 54 66 56 71 81 73 76 Construct a box and whisker plot for the data.arrow_forwardWhat are the most likely values of r for each plot of data shown below? Figure 1 *AT THE TOP r = -0.5 r = 0 r= 0.5 r = 1 ? Answer: Figure 2 *AT THE Bottom r = -0.5 r = 0 r= 0.5 r = 1 ? Answer:arrow_forwardpart (B)arrow_forward
arrow_back_ios
arrow_forward_ios
Recommended textbooks for you
 MATLAB: An Introduction with ApplicationsStatisticsISBN:9781119256830Author:Amos GilatPublisher:John Wiley & Sons Inc
 Probability and Statistics for Engineering and th...StatisticsISBN:9781305251809Author:Jay L. DevorePublisher:Cengage Learning
 Statistics for The Behavioral Sciences (MindTap C...StatisticsISBN:9781305504912Author:Frederick J Gravetter, Larry B. WallnauPublisher:Cengage Learning
 Elementary Statistics: Picturing the World (7th E...StatisticsISBN:9780134683416Author:Ron Larson, Betsy FarberPublisher:PEARSON
 The Basic Practice of StatisticsStatisticsISBN:9781319042578Author:David S. Moore, William I. Notz, Michael A. FlignerPublisher:W. H. Freeman
 Introduction to the Practice of StatisticsStatisticsISBN:9781319013387Author:David S. Moore, George P. McCabe, Bruce A. CraigPublisher:W. H. Freeman

MATLAB: An Introduction with Applications
Statistics
ISBN:9781119256830
Author:Amos Gilat
Publisher:John Wiley & Sons Inc

Probability and Statistics for Engineering and th...
Statistics
ISBN:9781305251809
Author:Jay L. Devore
Publisher:Cengage Learning

Statistics for The Behavioral Sciences (MindTap C...
Statistics
ISBN:9781305504912
Author:Frederick J Gravetter, Larry B. Wallnau
Publisher:Cengage Learning

Elementary Statistics: Picturing the World (7th E...
Statistics
ISBN:9780134683416
Author:Ron Larson, Betsy Farber
Publisher:PEARSON

The Basic Practice of Statistics
Statistics
ISBN:9781319042578
Author:David S. Moore, William I. Notz, Michael A. Fligner
Publisher:W. H. Freeman

Introduction to the Practice of Statistics
Statistics
ISBN:9781319013387
Author:David S. Moore, George P. McCabe, Bruce A. Craig
Publisher:W. H. Freeman