
MATLAB: An Introduction with Applications
6th Edition
ISBN: 9781119256830
Author: Amos Gilat
Publisher: John Wiley & Sons Inc
expand_more
expand_more
format_list_bulleted
Related questions
Question
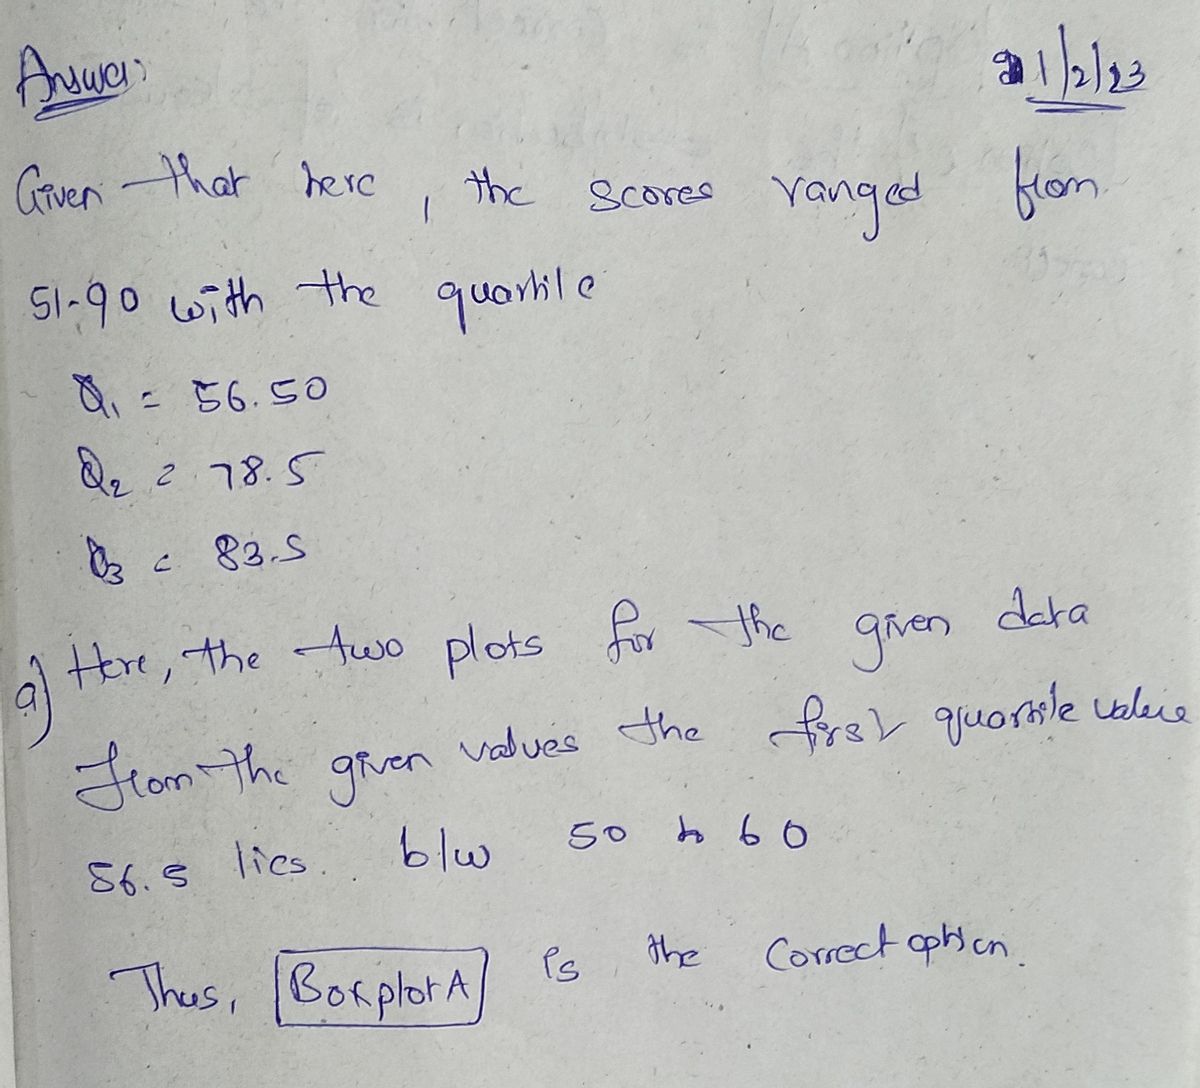
Scores on an accounting exam
(a) Select the correct box plot for the given data.
| BoxPlot A | BoxPlot B | BoxPlot C |
|---|---|---|
multiple choice 1
-
BoxPlot A
-
BoxPlot B
-
BoxPlot C
(b) Describe its shape (skewed left, symmetric, skewed right).
multiple choice 2
-
The distribution is skewed right.
-
The distribution is symmetric.
-
The distribution is skewed left.
Expert Solution
arrow_forward
Step 1

Step by stepSolved in 2 steps with 2 images

Knowledge Booster

Similar questions
- The data show the number of vacation days used by a sample of 20 employees in a recent year. Use technology to answer parts (a) and (b). a. Find the data set's first, second, and third quartiles. b. Draw a box-and-whisker plot that represents the data set. 1 5 4 3 6 0 5 3 4 5 3 1 10 7 8 6 1 2 89 a. Find the three quartiles. Q₁ = Q₂ = Q3 = (Type integers or decimals. Do not round.) b. Choose the correct answer plot below. Note that different technologies will produce slightly different results. O A. OB. Q Q C O C. Qarrow_forwardStudent grades on a chemistry exam were: 77; 78; 74; 81; 88; 51; 79; 82; 84; 91 Select the stem-and-leaf plot of the data. (a) Stem Leaf 5 51 6 7 77 78 74 79 8 81 88 82 84 9 91 (b) Stem Leaf 50 51 60 70 74 77 78 79 80 81 82 84 88 90 91 (c) Stem Leaf 5 1 6 7 4 7 8 9 8 1 2 4 8 9 1 (d) Stem Leaf 5 1 6 7 7 8 4 9 8 1 8 2 4 9 1 Are there any potential outliers? If so, which scores are they?If there are no outliers, enter NA.The field below accepts a list of numbers or formulas separated by semicolons (e.g. 2;4;6 or x+1;x−1). The order of the list does not matter.The outlier(s) is/are __________.arrow_forwardIt is generally believed that there is a relationship between a college’s acceptance rate and its graduation rate. I wanted to know how strong this relationship is within the top universities in the country so I collected the graduation rate and acceptance rate data of a randomly selected sample of universities from all the top U.S. universities (with an acceptance rate at or below 30%). The data set is in Tab Q2 of the Excel data file. a.) Create a scatter plot between the two variables using Excel. Paste the plot here and format it into an APA-styled “figure” (see Assignment Guides for APA format).Be sure to submit the Excel file that you used to create the scatter plot. b) Calculate the mean and standard deviation for the two variables separately. c) Calculate the Z scores for all the scores of the two variables, separately.Tips: It may help to prevent error and to increase clarity if the process and/or the answers (z scores) are listed in a table format. d) Calculate…arrow_forward
- Describe the shape of the data presented: 40.0% 35.0% 30.0% 25.0% 20.0% 15.0% 10.0% 5.0% 0.0% 36.1% 24.5% Ethnicity of Students Skewed to the right Skewed to the left Symmetric None of the above 17.1% 9.6% Asian White Hispanic Other/ Unknown 5.8% 5.3% Black Filipino 1.0% 0.6% Pacific Native Islander Americanarrow_forwardScores on an accounting exam ranged from 44 to 92, with quartiles Q1 = 49.50, Q2 = 67.5, and Q3 = 71.00. (a) Select the correct box plot for the given data. BoxPlot A BoxPlot B BoxPlot C multiple choice 1 BoxPlot A BoxPlot B BoxPlot C (b) Describe its shape (skewed left, symmetric, skewed right). multiple choice 2 The distribution is skewed right. The distribution is symmetric. The distribution is skewed left.arrow_forwardThe data below represent the number of streaming hours listened to per day by a sample of 9 people. Findarrow_forward
- Given the following box plot: 2 Which quartile contains the most data? 3rd quartile 2nd quartile They are all equal. 1st quartile 4th quartile Your answer is incorrect. You have correctly selected 0. How are the quartiles determined? + 10 12 13arrow_forwardIs the variable(foot print) below normally distributed or skewed? If skewed, indicate the direction. male shoe print #1 32.2 #2 30.1 #3 29.0 #4 31.8 #5 29.4arrow_forwardUse the stem-and-leaf plot to list the actual data entries. What is the maximum data entry? What is the minimum data entry? Key: 2 | 7=27 27 3 2 4 1224779 5 011233 3 4 4 4 4 56 689 6 999 7 399 8 5 Choose the correct actual data entries below. O A. 27, 32, 41, 42, 42, 44, 47, 47, 49, 50, 51, 51, 52, 53, 53, 53, 54, 54, 54, 54, 55, 56, 56, 58, 59, 69, 69, 69, 73, 79, 79, 85 B. 27, 32, 41, 42, 44, 47, 49, 50, 51, 52, 53, 54, 55, 56, 58, 59, 69, 73, 79, 85 OC. 2.7, 3.2, 4.1, 4.2, 4.4, 4.7, 4.9, 5.0, 5.1, 5.2, 5.3, 5.4, 5.5, 5.6, 5.8, 5.9,6.9, 7.3, 7.9, 8.5 O D. 2.7, 3.2, 4.1, 4.2, 4.2, 4.4, 4.7, 4.7, 4.9, 5.0, 5.1, 5.1, 5.2, 5.3, 5.3, 5.3, 5.4, 5.4, 5.4, 5.4, 5.5, 5.6, 5.6, 5.8, 5.9, 6.9, 6.9, 6.9, 7.3, 7.9, 7.9, 8.5 The maximum data entry is The minimum data entry isarrow_forward
- (6) Below is the exam score for 11 students: 90, 83, 89, 66, 80, 87, 95, 94, 70, 92, 83 Construct a stem-and-leaf plot for the data set, using the tenth digit as the stem and the unit digit as the leaf.arrow_forwardThe following data are the scores of 19 students on an algebra test. 62 , 84 , 87 , 92 , 55 , 75 , 85 , 63 , 58 , 70 , 60 , 86 , 95 , 61 , 92 , 65 , 84 , 75 , 64 Send data to calculator Send data to Excel Using the tool provided, construct a box-and-whisker plot (sometimes called a boxplot) for the data. 55 60 65 70 75 80 85 90 95 Score on algebra testarrow_forwardConsidering how the data is skewed, which value best represents the center of {12.8, 5.7, 7.9, 1.3, 3.2, 2.8}? 5.62 O 4.45 4.22 O 11.55arrow_forward
arrow_back_ios
SEE MORE QUESTIONS
arrow_forward_ios
Recommended textbooks for you
- MATLAB: An Introduction with ApplicationsStatisticsISBN:9781119256830Author:Amos GilatPublisher:John Wiley & Sons Inc
 Probability and Statistics for Engineering and th...StatisticsISBN:9781305251809Author:Jay L. DevorePublisher:Cengage Learning
 Statistics for The Behavioral Sciences (MindTap C...StatisticsISBN:9781305504912Author:Frederick J Gravetter, Larry B. WallnauPublisher:Cengage Learning
  Elementary Statistics: Picturing the World (7th E...StatisticsISBN:9780134683416Author:Ron Larson, Betsy FarberPublisher:PEARSON
 The Basic Practice of StatisticsStatisticsISBN:9781319042578Author:David S. Moore, William I. Notz, Michael A. FlignerPublisher:W. H. Freeman
 Introduction to the Practice of StatisticsStatisticsISBN:9781319013387Author:David S. Moore, George P. McCabe, Bruce A. CraigPublisher:W. H. Freeman
MATLAB: An Introduction with Applications
Statistics
ISBN:9781119256830
Author:Amos Gilat
Publisher:John Wiley & Sons Inc
Probability and Statistics for Engineering and th...
Statistics
ISBN:9781305251809
Author:Jay L. Devore
Publisher:Cengage Learning
Statistics for The Behavioral Sciences (MindTap C...
Statistics
ISBN:9781305504912
Author:Frederick J Gravetter, Larry B. Wallnau
Publisher:Cengage Learning
Elementary Statistics: Picturing the World (7th E...
Statistics
ISBN:9780134683416
Author:Ron Larson, Betsy Farber
Publisher:PEARSON
The Basic Practice of Statistics
Statistics
ISBN:9781319042578
Author:David S. Moore, William I. Notz, Michael A. Fligner
Publisher:W. H. Freeman
Introduction to the Practice of Statistics
Statistics
ISBN:9781319013387
Author:David S. Moore, George P. McCabe, Bruce A. Craig
Publisher:W. H. Freeman