
MATLAB: An Introduction with Applications
6th Edition
ISBN: 9781119256830
Author: Amos Gilat
Publisher: John Wiley & Sons Inc
expand_more
expand_more
format_list_bulleted
Related questions
Question
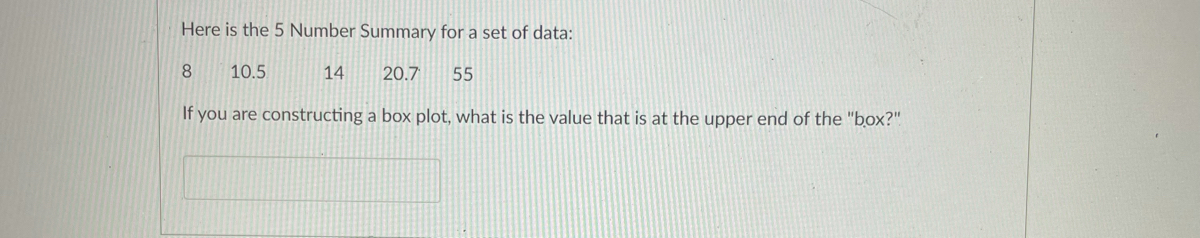

Transcribed Image Text:Here is the 5 Number Summary for a set of data:
8
10.5
14
20.7
55
If you are constructing a box plot, what is the value that is at the upper end of the "box?"
Expert Solution
This question has been solved!
Explore an expertly crafted, step-by-step solution for a thorough understanding of key concepts.

Step by stepSolved in 2 steps

Knowledge Booster

Similar questions
- Use the box and Whisker plot to answer the following Questions.Age of people who like Mint flavored Ice Cream.What is the Median Age of people who like Mint flavored Ice cream? A 30 B 90 C 50 D can’t tell from just this displayarrow_forwardStudents in a statistics class took their second test. The following are the scores they earned. Fill in the stem-and-leaf plot below use the tens place as the stem and the ones place as the leaf. Describe the shape of the distribution. a) Data were collected for variable(s). Is it appropriate to make a stem-and-leaf plot for this type of data and number of variables? . b) Complete the stem-and-leaf plot below. You must put commas between the leaves. c) What shape is the stem-and-leaf plot above?arrow_forwardUse the following data to identify the box and whisker plot: 48, 47, 16, 31, 26, 40, 11, 23, 50, 18, 42, 49, 19, 25, 10arrow_forward
- Here is the 5 Number Summary for a set of data: 1.55 2.8 3 3.44 3.93 If you are constructing a box plot, what is the value that is at the lower end of the "box?"arrow_forwardGive the 5-number summary and construct a box plot for the following 40 data values. Also, find P56- 25 35 43 44 47 48 54 55 56 57 59 62 63 65 66 68 69 69 71 72 72 73 74 76 77 77 78 79 80 81 81 82 83 85 89 92 93 94 97 98arrow_forwardWhat’s the q1, q2 and q3 here?arrow_forward
- Student grades on a chemistry exam were: 79, 78, 76, 82, 86, 50, 79, 81, 83, 99 Construct a stem-and-leaf plot of the data. (Use the tens digit as the stem and the ones digit as the leaf. Enter your answers from smallest to largest, separated by spaces. Enter NONE for stems with no leaves.) 5 6 7 8 9arrow_forward33555454333555(?,;gtarrow_forwardUse the box-and-whisker plot to identify the five-number summary. 940 2081 1205 1477 1957 900 1200 1500 1800 2100arrow_forward
- The value of a certain car when it was brand new with 0 mileage was $17,000 but the value dropped to $4,000 when the car acounulated 80,000 miles shown in the scatter plot below. Car's Mleage and Value S17.000 $2,000 Mileage Based on the data in the scatter plot, at what mileage was the car worth about $12,000? O 20,000 miles O 30,000 miles O 60,000 miles O 80,000 milesarrow_forwardpls help mearrow_forwardThe boxes below contain 14 numbers, listed in order, of which 6 have been removed. Your job is to use the clues given to determine the missing numbers. Write your answers in the boxes. Mean is 26 The median is 22 The interquartile range is 20 The mode is 18 The range is 60 1 4 15 18 29 30 32 58 Second assignment 1) Use Technology (Desmos Calculator) to create a dot plot that represents the distribution of the data. Then describe the shape of the distribution. (look at past notes about shapes) 6 14 11 8 13 10 10 12 12 10 7 11 9 11 9 11 9 8 2) Find the mean and the median of the data. 3) Find the mean and median of the data with 2 additional values included as described. a) add 2 values to the original data set that are greater than 14. b) add 2 values to the original data set that are less than 6. c) Ass 1 value that is greater than 14 and 1 value that is less than 6 to the original data set. d) Add the two values, 50 and 100. To the…arrow_forward
arrow_back_ios
SEE MORE QUESTIONS
arrow_forward_ios
Recommended textbooks for you
- MATLAB: An Introduction with ApplicationsStatisticsISBN:9781119256830Author:Amos GilatPublisher:John Wiley & Sons Inc
 Probability and Statistics for Engineering and th...StatisticsISBN:9781305251809Author:Jay L. DevorePublisher:Cengage Learning
 Statistics for The Behavioral Sciences (MindTap C...StatisticsISBN:9781305504912Author:Frederick J Gravetter, Larry B. WallnauPublisher:Cengage Learning
  Elementary Statistics: Picturing the World (7th E...StatisticsISBN:9780134683416Author:Ron Larson, Betsy FarberPublisher:PEARSON
 The Basic Practice of StatisticsStatisticsISBN:9781319042578Author:David S. Moore, William I. Notz, Michael A. FlignerPublisher:W. H. Freeman
 Introduction to the Practice of StatisticsStatisticsISBN:9781319013387Author:David S. Moore, George P. McCabe, Bruce A. CraigPublisher:W. H. Freeman
MATLAB: An Introduction with Applications
Statistics
ISBN:9781119256830
Author:Amos Gilat
Publisher:John Wiley & Sons Inc
Probability and Statistics for Engineering and th...
Statistics
ISBN:9781305251809
Author:Jay L. Devore
Publisher:Cengage Learning
Statistics for The Behavioral Sciences (MindTap C...
Statistics
ISBN:9781305504912
Author:Frederick J Gravetter, Larry B. Wallnau
Publisher:Cengage Learning
Elementary Statistics: Picturing the World (7th E...
Statistics
ISBN:9780134683416
Author:Ron Larson, Betsy Farber
Publisher:PEARSON
The Basic Practice of Statistics
Statistics
ISBN:9781319042578
Author:David S. Moore, William I. Notz, Michael A. Fligner
Publisher:W. H. Freeman
Introduction to the Practice of Statistics
Statistics
ISBN:9781319013387
Author:David S. Moore, George P. McCabe, Bruce A. Craig
Publisher:W. H. Freeman