
MATLAB: An Introduction with Applications
6th Edition
ISBN: 9781119256830
Author: Amos Gilat
Publisher: John Wiley & Sons Inc
expand_more
expand_more
format_list_bulleted
Related questions
Question
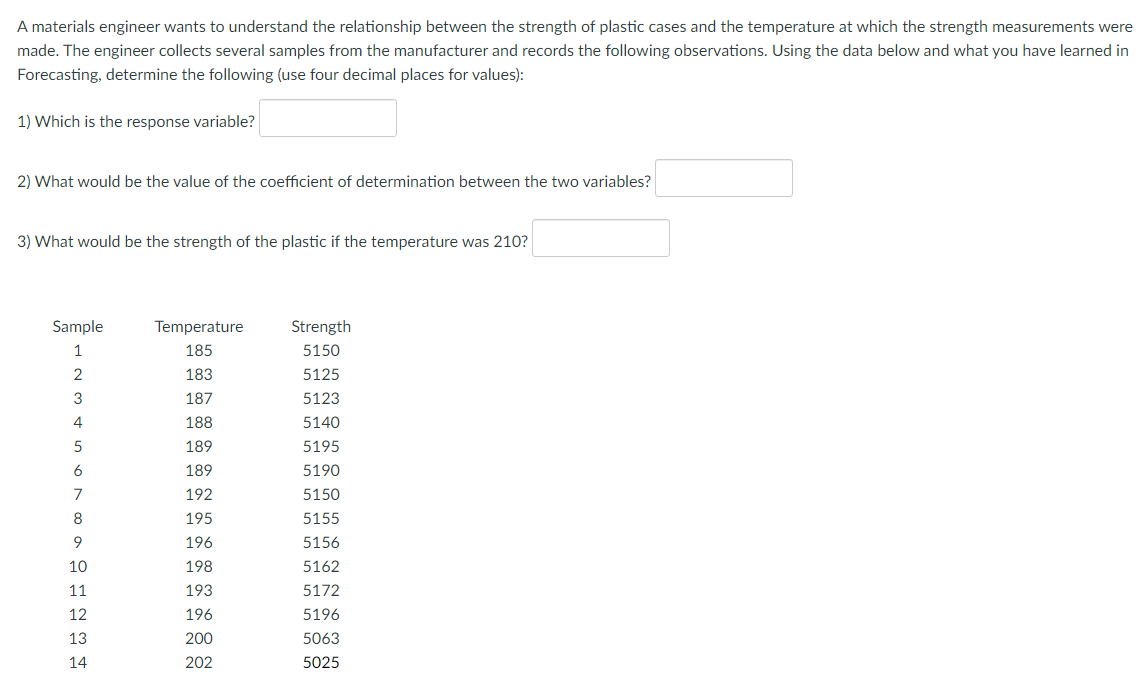

Transcribed Image Text:A materials engineer wants to understand the relationship between the strength of plastic cases and the temperature at which the strength measurements were
made. The engineer collects several samples from the manufacturer and records the following observations. Using the data below and what you have learned in
Forecasting, determine the following (use four decimal places for values):
1) Which is the response variable?
2) What would be the value of the coefficient of determination between the two variables?
3) What would be the strength of the plastic if the temperature was 210?
Sample
Temperature
Strength
1
185
5150
2
183
5125
3
187
5123
4
188
5140
5
189
6
189
M
5195
5190
5150
7
192
8
195
5155
9
196
5156
10
198
5162
11
193
5172
12
196
5196
13
200
5063
202
5025
14
Expert Solution
This question has been solved!
Explore an expertly crafted, step-by-step solution for a thorough understanding of key concepts.

Step by stepSolved in 4 steps with 1 images

Knowledge Booster

Similar questions
- Day Revenue Occupied 1 1452 32 2 1361 20 3 1426 21 4 1470 25 5 1456 26 6 1430 23 7 1354 20 8 1442 39 9 1394 15 10 1459 50 11 1399 41 12 1458 35 13 1537 41 14 1425 31 15 1445 51 16 1439 62 17 1348 45 18 1450 41 19 1431 62 20 1446 47 21 1485 43 22 1405 38 23 1461 36 24 1490 60 25 1426 65arrow_forward18 10 20 6. 21 8. 30 10 25 26 7. 19 29 9. 31 10 55 32 4. 28 3. 23 2. 24 32arrow_forward5. 53 to 123 – 53 8. Digital Resources at PearsonRealize.comarrow_forward
- An automotive part must be machined to close tolerances to be acceptable to customers. Production specifications call for a maximum variance in the lengths of the parts of 0.0004. A quality control sample produced the data in the Microsoft Excel Online file below. Using a = 0.05, test to see whether the population variance specification is being violated. X Open spreadsheet 1. Formulate the null and alternative hypotheses for this application. Ho: 0² Ha: 0² 2. Test statistic = 3. The p-value is 4. Conclusion: 5. Test results: Check My Work ↑ î (to 2 decimals) Reset Problem ŵ ↑arrow_forward141% v Zoom Add Page Insert Table Chart Text Shape Media Comment Collaborate Format Document 13! 6227020800 14! 87178291200 This document has missing fonts. Show 15! 1307674368000 16! 20922789888000 17! 355687428096000 18! 6402373705728000 19! 121645100408832000 20! 2432902008176640000 2) After a recent bank robbery, three eyewitnesses reported seeing a man with glasses flee the scene. The police suspect Ricky and make up an identity parade of five men with glasses. Ricky takes his place in the parade alongside four randomly chosen stooges. Two of the eyewitnesses identify Ricky and the third points to one of the stooges. What's the probability that Ricky would have been chosen by two of the three eyewitnesses if each witness had chosen completely at random? Solve this problem using the Binomial Probability Mass Function. (Tip: This problem will be easier to solve if you first find p, the probability of success on any one trial; in other words, the probability of a single eyewitness…arrow_forwardAn experiment was performed to determine whether different types of chocolate take different amounts of time to dissolve. Forty people were divided into five groups. Each group was assigned a certain type of chocolate. Each person dissolved one piece of chocolate, and the dissolve time (in seconds) was recorded. For comparison, each person in each group also dissolved one piece of butterscotch candy; these pieces were identical for all groups. The data, which include the group, the dissolve times for both chocolate and butterscotch, the difference between the dissolve times, and the ratio of the dissolve times, are presented in the following table. Note that the design is slightly unbalanced; group 3 has nine people and group 5 has only seven. Group Chocolate Butterscotch Difference Ratio 60 135 75 2.25 865 635 230 1.36 122 63 59 1.94 110 75 35 1.47 71 37 34 1.92 81 58 23 1.40 2405 1105 1300 2.18arrow_forward
- 19 Males Females85 7877 9648 5760 6850 5562 8155 7876 8651 8864 5572 3760 6563 8680 7780 7863 6468 6398 7840 6283 6770 8462 8375 6870 7655 8466 8953 8779 9272 9066 9566 6897 9060 8064 8157 7459 5565 10171 7484 7858 79arrow_forwardStudent ID Math Score Project Score Age (years) Sex 001254 52 75 15 M 003256 78 89 15 F 001547 92 82 18 F 012589 91 66 17 M 021475 72 93 14 M 032658 46 76 13 M 009561 68 76 14 F 008654 52 82 12 F 008561 83 75 16 M 003547 45 78 14 F 047452 73 96 14 M 041212 64 79 13 F 032320 41 67 13 F 000258 77 72 15 F 001478 82 75 17 M 019521 59 83 15 M 017451 80 71 17 F 016335 48 76 13 M 002474 57 80 14 F 095844 97 71 18 F 097304 86 86 17 M 090024 75 85 15 F 034702 81 80 16 F 001910 67 74 14 F 006454 86 77 17 M 087478 63 82 13 M 078474 68 79 14 F 000977 54 89 12 M 063010 91 73 18 M 007406 46 77 15 F 025740 93 85 17 M…arrow_forwardMale Female 27,767 20,516 17,413 24,972 6,080 4,900 28,523 17,661 25,137 11,901 9,821 17,562 21,857 9,865 16,491 21,047 27,687 12,095 23,361 20,089 12,272 16,244 9,584 14,395 13,562 15,467 23,151 23,501 20,071 5,715 142 19,698 21,957 21,640 8,722 18,345 21,058 16,616 17,940 15,249 15,001 28,849 20,938 6,825 6,151 17,111 8,370 4,197 27,687 12,989 11,589 16,879 12,021 13,322 13,709 20,292 12,888 19,417 17,879 14,061 13,743 32,349 11,268 8,738 22,102 10,475 16,788 11,971 10,387 28,702 13,809 22,947 15,644 16,386 11,044 20,101 17,933 20,564 11,413 14,483 11,842 17,349 6,794…arrow_forward
- Presidential Inaugural Addresses Ever wonder how many words are in a typical inaugural address? The following data represent the lengths of all the inaugural addresses (measured in word count) for all presidents up to Barack Obama. 1425 1125 1128 5433 2242 2283 3319 2015 3217 135 4467 2308 2906 2821 1172 3967 1337 1883 1668 2406 2217 2480 1807 3634 3838 698 985 559 2978 3318 1355 Source: infoplease.com 1802 1340 1526 2158 4776 1681 4059 996 4388 3801 1087 2446 2130 1507 2463 2449 2170 2546 1729 8445 1571 209 1437 2073 1175arrow_forwardWhat is the medianarrow_forwardFind the five-number summary of the scores in the Math 130 test pre-sented in Table 4.1, page 112. Draw the boxplot.arrow_forward
arrow_back_ios
SEE MORE QUESTIONS
arrow_forward_ios
Recommended textbooks for you
- MATLAB: An Introduction with ApplicationsStatisticsISBN:9781119256830Author:Amos GilatPublisher:John Wiley & Sons Inc
 Probability and Statistics for Engineering and th...StatisticsISBN:9781305251809Author:Jay L. DevorePublisher:Cengage Learning
 Statistics for The Behavioral Sciences (MindTap C...StatisticsISBN:9781305504912Author:Frederick J Gravetter, Larry B. WallnauPublisher:Cengage Learning
  Elementary Statistics: Picturing the World (7th E...StatisticsISBN:9780134683416Author:Ron Larson, Betsy FarberPublisher:PEARSON
 The Basic Practice of StatisticsStatisticsISBN:9781319042578Author:David S. Moore, William I. Notz, Michael A. FlignerPublisher:W. H. Freeman
 Introduction to the Practice of StatisticsStatisticsISBN:9781319013387Author:David S. Moore, George P. McCabe, Bruce A. CraigPublisher:W. H. Freeman
MATLAB: An Introduction with Applications
Statistics
ISBN:9781119256830
Author:Amos Gilat
Publisher:John Wiley & Sons Inc
Probability and Statistics for Engineering and th...
Statistics
ISBN:9781305251809
Author:Jay L. Devore
Publisher:Cengage Learning
Statistics for The Behavioral Sciences (MindTap C...
Statistics
ISBN:9781305504912
Author:Frederick J Gravetter, Larry B. Wallnau
Publisher:Cengage Learning
Elementary Statistics: Picturing the World (7th E...
Statistics
ISBN:9780134683416
Author:Ron Larson, Betsy Farber
Publisher:PEARSON
The Basic Practice of Statistics
Statistics
ISBN:9781319042578
Author:David S. Moore, William I. Notz, Michael A. Fligner
Publisher:W. H. Freeman
Introduction to the Practice of Statistics
Statistics
ISBN:9781319013387
Author:David S. Moore, George P. McCabe, Bruce A. Craig
Publisher:W. H. Freeman