
MATLAB: An Introduction with Applications
6th Edition
ISBN: 9781119256830
Author: Amos Gilat
Publisher: John Wiley & Sons Inc
expand_more
expand_more
format_list_bulleted
Related questions
Question
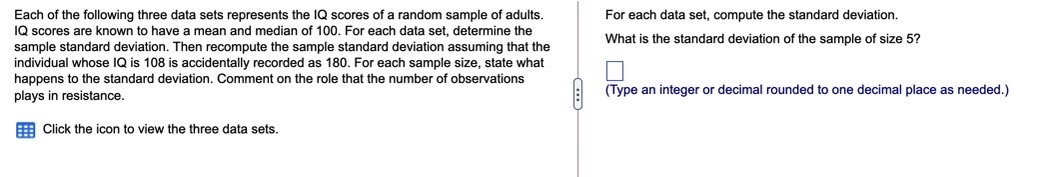

Transcribed Image Text:Each of the following three data sets represents the IQ scores of a random sample of adults.
IQ scores are known to have a mean and median of 100. For each data set, determine the
sample standard deviation. Then recompute the sample standard deviation assuming that the
individual whose IQ is 108 is accidentally recorded as 180. For each sample size, state what
happens to the standard deviation. Comment on the role that the number of observations
plays in resistance.
For each data set, compute the standard deviation.
What is the standard deviation of the sample of size 5?
(Type an integer or decimal rounded to one decimal place as needed.)
E Click the icon to view the three data sets.

Transcribed Image Text:Full data set
Sample of Size 5
110 118 100
108
91
Sample of Size 12
110 118 100 104
95
108
91
94
92
116 114 116
Sample of Size 30
108
91
110 118 100 104
94
95
92
116 114 116
116 113
110 115 114
118
93
93
119 113 98
106
95
118 116 | 115
99
Expert Solution
This question has been solved!
Explore an expertly crafted, step-by-step solution for a thorough understanding of key concepts.

This is a popular solution

Trending nowThis is a popular solution!

Step by stepSolved in 2 steps with 2 images

Knowledge Booster

Similar questions
- Assume that adults have IQ scores that are normally distributed with a mean of u= 105 and a standard deviation o = 15. Find the probability that a randomly selected adult has an IQ between 91 and 119. Click to view page 1 of the table. Click to view page 2 of the table. ces The probability that a randomly selected adult has an IQ between 91 and 119 is (Type an integer or decimal rounded to four decimal places as needed.) Exp The usearrow_forwardAssume that adults have IQ scores that are normally distributed with a mean of u= 100 and a standard deviation g= 15. Find the probability that a randomly selected adult has an IQ less than 118. Click to view page 1 of the table. Click to view page 2 of the table. The probability that a randomly selected adult has an IQ less than 118 is (Type an integer or decimal rounded to four decimal places as needed.)arrow_forwardFind the variance and the standard deviation for the following numbers: 1, 5, 6, 8. Show all your work. Do not simplify fractions/products/similar.arrow_forward
- Find the standard deviation (rounded to the nearest unit) for the data indicated. Test Score Frequency 90 1 80 4 70 7 60 6 50 3arrow_forwardFind the mean and standard deviation of the number of red-headed Scots in a randomly selected group of 155. The probability of having red hair is still 13% for Scottish people. a. Mean = b. Standard deviation (Round to 2 places)=arrow_forwardListed in the data table are IQ scores for a random sample of subjects with medium lead levels in their blood. Also listed are statistics from a study done of IQ scores for a random sample of subjects with high lead levels. Assume that the two samples are independent simple random samples selected from normally distributed populations. Do not assume that the population standard deviations are equal. Complete parts (a) and (b) below. Click the icon to view the data table of IQ scores. a. Use a 0.05 significance level to test the claim that the mean IQ scores for subjects with medium lead levels is higher than the mean for subjects with high lead levels. What are the null and alternative hypotheses? Assume that population 1 consists of subjects with medium lead levels and population 2 consists of subjects with high lead levels. X A. Ho: H₁ H₂ H₁ H₁ H₂ c. Ho: M₁ = H₂ H₁: H₁ H₂ The test statistic is 0.56. (Round to two decimal places as needed.) The P-value is (Round to three decimal…arrow_forward
- An insurance company crashed four cars in succession at 5 miles per hour. The cost of repair for each of the four crashes was $425, $462, 5405, $234 a . Compute the range, sample variance, and sample standard deviation cost of repair. The range is $ s2 = dollars? (Round to the nearest whole number as needed.) s= SI (Round to two decimal places as needed.)arrow_forwardUse the Central Limit Theorem to find the mean and standard error of the mean of the sampling distribution. Then sketch a graph of the sampling distribution. The mean price of photo printers on a website is $227 with a standard deviation of $69. Random samples of size 31 are drawn from this population and the mean of each sample is determined. The mean of the distribution of sample means is nothing.arrow_forward
arrow_back_ios
arrow_forward_ios
Recommended textbooks for you
- MATLAB: An Introduction with ApplicationsStatisticsISBN:9781119256830Author:Amos GilatPublisher:John Wiley & Sons Inc
 Probability and Statistics for Engineering and th...StatisticsISBN:9781305251809Author:Jay L. DevorePublisher:Cengage Learning
 Statistics for The Behavioral Sciences (MindTap C...StatisticsISBN:9781305504912Author:Frederick J Gravetter, Larry B. WallnauPublisher:Cengage Learning
  Elementary Statistics: Picturing the World (7th E...StatisticsISBN:9780134683416Author:Ron Larson, Betsy FarberPublisher:PEARSON
 The Basic Practice of StatisticsStatisticsISBN:9781319042578Author:David S. Moore, William I. Notz, Michael A. FlignerPublisher:W. H. Freeman
 Introduction to the Practice of StatisticsStatisticsISBN:9781319013387Author:David S. Moore, George P. McCabe, Bruce A. CraigPublisher:W. H. Freeman
MATLAB: An Introduction with Applications
Statistics
ISBN:9781119256830
Author:Amos Gilat
Publisher:John Wiley & Sons Inc
Probability and Statistics for Engineering and th...
Statistics
ISBN:9781305251809
Author:Jay L. Devore
Publisher:Cengage Learning
Statistics for The Behavioral Sciences (MindTap C...
Statistics
ISBN:9781305504912
Author:Frederick J Gravetter, Larry B. Wallnau
Publisher:Cengage Learning
Elementary Statistics: Picturing the World (7th E...
Statistics
ISBN:9780134683416
Author:Ron Larson, Betsy Farber
Publisher:PEARSON
The Basic Practice of Statistics
Statistics
ISBN:9781319042578
Author:David S. Moore, William I. Notz, Michael A. Fligner
Publisher:W. H. Freeman
Introduction to the Practice of Statistics
Statistics
ISBN:9781319013387
Author:David S. Moore, George P. McCabe, Bruce A. Craig
Publisher:W. H. Freeman