
FINANCIAL ACCOUNTING
10th Edition
ISBN: 9781259964947
Author: Libby
Publisher: MCG
expand_more
expand_more
format_list_bulleted
Related questions
Question
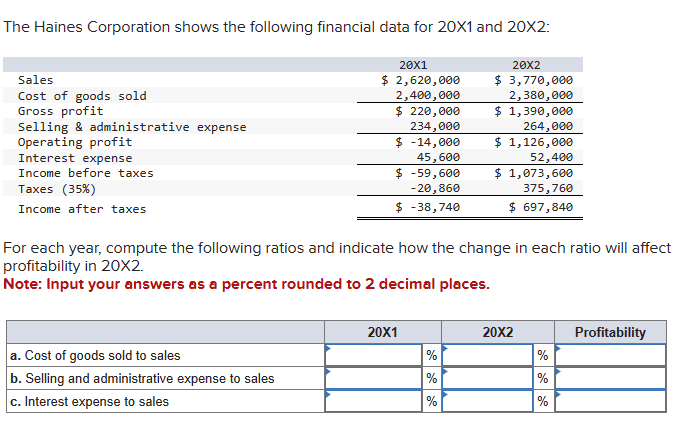

Transcribed Image Text:The Haines Corporation shows the following financial data for 20X1 and 20X2:
Sales
Cost of goods sold
Gross profit
Selling & administrative expense
Operating profit
Interest expense
Income before taxes
Taxes (35%)
Income after taxes
20X1
$ 2,620,000
2,400,000
$ 220,000
234,000
-14,000
45, 600
$ -59,600
-20,860
$
$ -38,740
a. Cost of goods sold to sales
b. Selling and administrative expense to sales
c. Interest expense to sales
For each year, compute the following ratios and indicate how the change in each ratio will affect
profitability in 20X2.
Note: Input your answers as a percent rounded to 2 decimal places.
20X1
20X2
$ 3,770,000
2,380,000
$ 1,390,000
264,000
$ 1,126,000
52,400
%
%
%
$ 1,073,600
375,760
$ 697,840
20X2
%
%
%
Profitability
Expert Solution
This question has been solved!
Explore an expertly crafted, step-by-step solution for a thorough understanding of key concepts.

This is a popular solution

Trending nowThis is a popular solution!

Step by stepSolved in 5 steps

Knowledge Booster


Learn more about
Need a deep-dive on the concept behind this application? Look no further. Learn more about this topic, accounting and related others by exploring similar questions and additional content below.Similar questions
- Following is an incomplete current-year income statement. Determine Net Sales, Cost of goods sold and Net Income. Additional information follows: Return on total assets is 16% (average total assets is $62,500). Inventory turnover is 5 (average inventory is $7,800). Accounts receivable turnover is 8 (average accounts receivable is $7,700). Income Statement Net Sales Cost of goods sold Selling, general, and administrative expenses 8800 Income tax expenses 3800 Net Incomearrow_forwardFor the Year Ended December 31, 2020 Sales Revenue Cost of Goods Sold Gross Profit Operating Expenses Selling Expenses: Salaries Expense Rent Expense Advertising Expense Total Selling Expenses Administrative Expenses: Salaries Expense Insurance Expense Rent Expense Deprecaition Expense Total Administrative Expenses Total Operating Expenses Operating Income Other Income and Expenses Sales Discounts Forfeited 125,466 45,167 80,299 2,615 725 3,340 12,543 2,563 1,562 1,253 17,921 21,261 59,038 1,575 (265) Interest Expenses Total Other Income and Expenses Net Income 1,310 57.728 What type of financial statement is this? Statement of Owner's Equity Multiple-step Income Statement Balance Sheet O Single-step Income Statementarrow_forwardGet The Correct Answerarrow_forward
- Use the following to answer questions 34 – 39 ST reports the following income statement results: $700,000 221,575 Sales Operating expense Net income 48,800 Sales returns & allowances 25,000 Gross profit 282,825 Interest expense 250 34. $ Calculate Net sales: 35. Calculate Cost of Goods Sold Calculate operating 36. income 37. $ Calculate Income before Income tax (IBT) %. Calculate the gross profit 38. margin (one decimal place) %. Calculate the net profit margin (one 39. decimal place)arrow_forwardThe following percentages apply to Rooney Company for Year 3 and Year 4: Sales Cost of goods sold Gross margin Selling and administrative expense Interest expense Total expenses Income before taxes Income tax expense Net income ROONEY COMPANY Income Statements Sales Cost of goods sold Gross margin Selling and administrative expenses Interest expense Total expenses Income before taxes Income tax expense Net income Required Assuming that sales were $505,000 in Year 3 and $600,000 in Year 4, prepare income statements for the two years. Year 4 100.0 % 61.1 38.9 26.2 2.4 Year 4 28.6 10.3 5.3 5.0 % Year 3 100.0 % 64.1 35.9 20.5 1.9 22.4 13.5 7.0 6.5 % Year 3arrow_forwardPROVIDE Answerarrow_forward
- Interest expense = 36,000. Sales revenue = 2,195,000. Interest and dividends = 9,000. Selling expenses = 253,000. Administrative expenses = 104,000. Sales returns and allowances = 98,000. Income tax expense = 168,200. Cost of goods sold = 1,281,000. How much is the gross profit?arrow_forwardam. 05.arrow_forwardNeed answerarrow_forward
- Sales Cost of goods sold Gross profit Fixed charges (other than interest) Income before interest and taxes Interest Income before taxes Taxes (35%) Income after taxes. LANCASTER CORPORATION a. What is the times-interest-earned ratio? Note: Round your answer to 2 decimal places. Times interest earned Fixed charge coverage times b. What would be the fixed-charge-coverage ratio? Note: Round your answer to 2 decimal places. times $ 259,000 209,000 $ 50,000 24,500 $ 25,500 19,000 $ 6,500 2,275 $ 4,225arrow_forwardThe company reports the following income statement results: Gross profit $500,000 Interest expense 15,000 Sales discounts 8,000 Net Sales Operating expense Effective tax rate $ $ $ 990,000 365,000 18% Calculate Sales. Calculate Income before Income tax (IBT). Calculate net income. % Calculate the gross profit margin (one decimal place) % Calculate the profit margin (two decimal places)arrow_forwardPlease provide correct answerarrow_forward
arrow_back_ios
SEE MORE QUESTIONS
arrow_forward_ios
Recommended textbooks for you
 AccountingAccountingISBN:9781337272094Author:WARREN, Carl S., Reeve, James M., Duchac, Jonathan E.Publisher:Cengage Learning,
 Accounting Information SystemsAccountingISBN:9781337619202Author:Hall, James A.Publisher:Cengage Learning,
 Horngren's Cost Accounting: A Managerial Emphasis...AccountingISBN:9780134475585Author:Srikant M. Datar, Madhav V. RajanPublisher:PEARSON
 Intermediate AccountingAccountingISBN:9781259722660Author:J. David Spiceland, Mark W. Nelson, Wayne M ThomasPublisher:McGraw-Hill Education
 Financial and Managerial AccountingAccountingISBN:9781259726705Author:John J Wild, Ken W. Shaw, Barbara Chiappetta Fundamental Accounting PrinciplesPublisher:McGraw-Hill Education
Accounting
Accounting
ISBN:9781337272094
Author:WARREN, Carl S., Reeve, James M., Duchac, Jonathan E.
Publisher:Cengage Learning,
Accounting Information Systems
Accounting
ISBN:9781337619202
Author:Hall, James A.
Publisher:Cengage Learning,
Horngren's Cost Accounting: A Managerial Emphasis...
Accounting
ISBN:9780134475585
Author:Srikant M. Datar, Madhav V. Rajan
Publisher:PEARSON
Intermediate Accounting
Accounting
ISBN:9781259722660
Author:J. David Spiceland, Mark W. Nelson, Wayne M Thomas
Publisher:McGraw-Hill Education
Financial and Managerial Accounting
Accounting
ISBN:9781259726705
Author:John J Wild, Ken W. Shaw, Barbara Chiappetta Fundamental Accounting Principles
Publisher:McGraw-Hill Education