
MATLAB: An Introduction with Applications
6th Edition
ISBN: 9781119256830
Author: Amos Gilat
Publisher: John Wiley & Sons Inc
expand_more
expand_more
format_list_bulleted
Related questions
Topic Video
Question
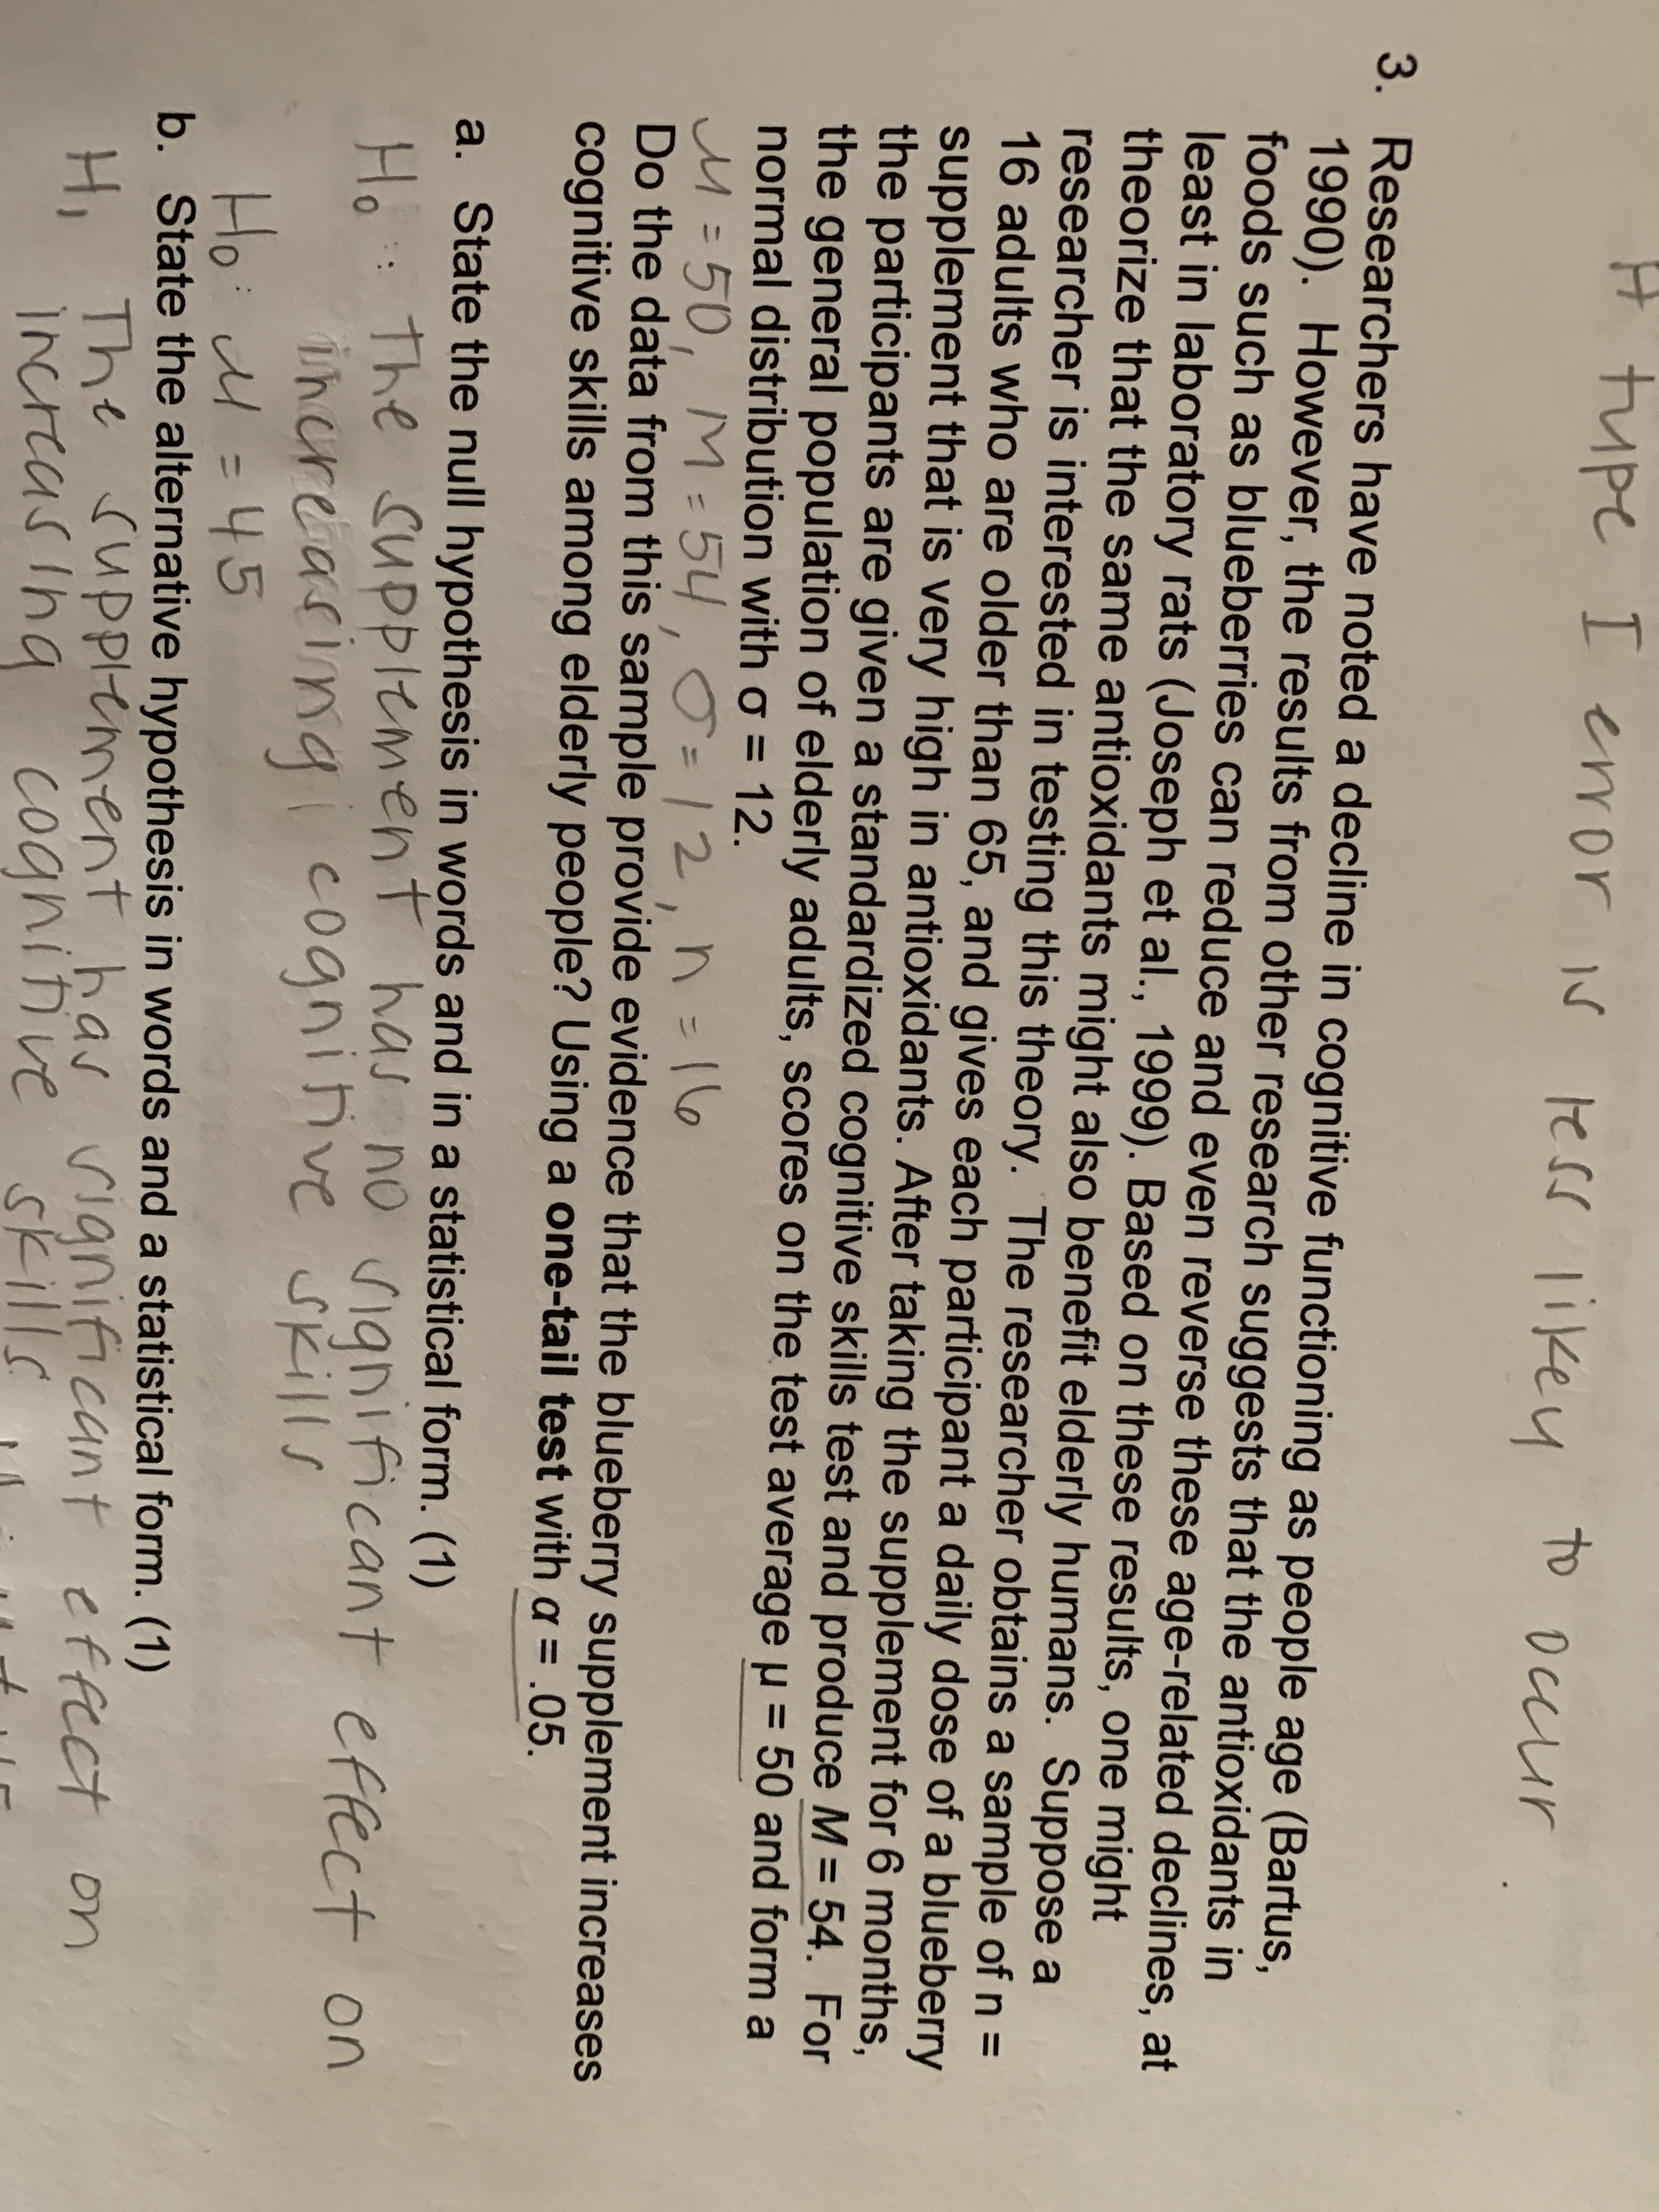

Transcribed Image Text:Researchers have noted a decline
1990). However, the results from
foods such as blueberries can red
least in laboratory rats (Joseph et
theorize that the same antioxidant
researcher is interested in testing
16 adults who are older than 65, a
supplement that is very high in ant
the participants are given a standa
the general population of elderly ac
normal distribution with o = 12.
M=D50, M = 54, 0= 1 2,
Do the data from this sample provic
cognitive skills among elderly peop
%3D
a. State the null hypothesis in word
Ho: The supplement
increasing co
Ho: M =45
b. State the alternative hypothesis
%3D
Hi The SUpPlement
Expert Solution
This question has been solved!
Explore an expertly crafted, step-by-step solution for a thorough understanding of key concepts.

Step by stepSolved in 4 steps with 8 images

Knowledge Booster


Learn more about
Need a deep-dive on the concept behind this application? Look no further. Learn more about this topic, statistics and related others by exploring similar questions and additional content below.Similar questions
- According to a CCH Unscheduled Absence survey 9 of small According to a CCH Unscheduled Absence survey, 9% of small businesses use telecommuting of workers in an effort to reduce unscheduled absenteeism. This proportion compares to 6% for all businesses. Is there really a significant difference between small businesses and all businesses on this issue? Use these data and an alpha of .10 to test this question. Assume that there were 780 small businesses and 915 other businesses in this survey. According to a CCH Unscheduled Absence survey 9 of smallarrow_forwardCitrus Rental is a popular car rental agency that has a history of having too few cars available, so that its available cars are overdriven. The mean monthly mileage over the years for Citrus cars has been about 1550 miles per month. Recently, though, Citrus purchased thousands of new cars, and the company claims that the average mileage of its cars is now less than in the past. To test this, a random sample of 13 recent mileages of Citrus cars was taken. The mean of these 13 mileages was 1425 miles per month, and the standard deviation was 209 miles per month. Assume that the population of recent monthly mileages of Citrus cars is normally distributed. At the 0.10 level of significance, can it be concluded that the mean recent monthly mileage, μ, of Citrus cars is less than 1550 miles per month? Perform a one-tailed test. Then complete the parts below. Carry your intermediate computations to three or more decimal places and round your answers as specified in the table. (If necessary,…arrow_forwardWhat is the answer of the 7.14 question?arrow_forward
- Data from the Department of Motor Vehicles indicate that 80% of all licensed drivers are older than age 25. In a sample of n = 50 people who recently received speeding tickets, 33 were older than age 25 and the other 17 were age 25 or younger. Is the age distribution for this sample significantly different from the distribution for the population of licensed drivers? Use alpha = .05. In a sample of n = 50 people who recently received parking tickets, 36 were older than age 25 and the other 14 were age 25 or younger. Is the age distribution for this sample significantly different from the distribution for the population of licensed drivers? Use alpha = .05.arrow_forwardCitrus Rental is a popular car rental agency that has a history of having too few cars available, so that its available cars are overdriven. The mean monthly mileage over the years for Citrus cars has been about 1600 miles per month. Recently, though, Citrus purchased thousands of new cars, and the company claims that the average mileage of its cars is now less than in the past. To test this, a random sample of 16 recent mileages of Citrus cars was taken. The mean of these 16 mileages was 1517 miles per month, and the standard deviation was 233 miles per month. Assume that the population of recent monthly mileages of Citrus cars is normally distributed. At the 0.05 level of significance, can it be concluded that the mean recent monthly mileage, μ, of Citrus cars is less than 1600 miles per month? Perform a one-tailed test. Then complete the parts below. Carry your intermediate computations to three or more decimal places and round your answers as specified in the table. (If necessary,…arrow_forwardTime to Complete the Course Right 45 47 50 49 50 50 48 44 Left | 45 | 43 48 47 50 52 | 44 42 Assume a Normal distribution. What can be concluded at the the a = 0.01 level of significance level of significance? For this study, we should use t-test for the difference between two dependent population means a. The null and alternative hypotheses would be: p1 p2 Ні: p1 p2 b. The test statistic t v v = 1.199 (please show your answer to 3 decimal places.) c. The p-value = [1338 your answer to 4 decimal places.) d. The p-value is > va e. Based on this, we should fail to reject f. Thus, the final conclusion is that ... * (Please show v the null hypothesis. O The results are statistically insignificant at a = 0.01, so there is insufficient evidence to conclude that the population mean time to complete the obstacle course with a patch overarrow_forward
- Denny studied factors affecting cardiovascular reactivity to a postural change in a sample of healthy men and women. Change in systolic blood pressure (SBP) from supine to standing position was used as the measure of cardiac reactivity in a sample of 842 adults. Supine measurement of blood pressure was taken after participants had lain on an examination table for 15 minutes. Blood pressure was determined every 30 seconds using a Dinamap device for 2 minutes, and the measurements were averaged. Participants then stood up immediately, and additional measurements were made for another 2 minutes. Below is a table describing the characteristics of Denny’s sample: Which measures of dispersion, if any, are presented in this table (Ranges, SDs)? If age is normally distributed, approximately what percent of the sample would be younger than 50? If BMI is normally distributed, approximately what percent of the sample would have a BMI higher than 33.1?arrow_forwardWhen only two treatments are involved, ANOVA and the Student’s t-test (Chapter 11) result in the same conclusions. Also, for computed test statistics, t2 = F. To demonstrate this relationship, use the following example. Fourteen randomly selected students enrolled in a history course were divided into two groups, one consisting of six students who took the course in the normal lecture format. The other group of eight students took the course in a distance format. At the end of the course, each group was examined with a 50-item test. The following is a list of the number correct for each of the two groups. Traditional Lecture Distance 36 45 31 35 40 45 34 35 33 45 38 36 43 41 a-1. Complete the ANOVA table. (Round your SS, MS, and F values to 2 decimal places and p-value, F crit to 4 decimal places.) Source of Variation SS df MS F p-value F crit Treatment 96.01 1 96.01 5.67 0.0350 Error 203.21 12 16.93 Total 299.21 13…arrow_forwardQuestion 7 > You wish to test the following claim (Ha) at a significance level of a = 0.05. H.: 41 Ha: µ1 7 42 You believe both populations are normally distributed, but you do not know the standard deviations for either. However, you have reason to believe that the variances of the two populations are equal. You obtain a sample of size nį = 14 with a mean of M1 first population. You obtain a sample of size n2 of SD2 = 7.4 from the second population. = 67.8 and a standard deviation of SD1 19 with a mean of M2 15.5 from the 61.7 and a standard deviation In the answer box below insert 2.0395 as the critical value for this test. (Report answer accurate to three decimal places.) critical value What is the test statistic for this sample? (Report answer accurate to three decimal places.) test statistic = %3D The test statistic is... O in the critical region O not in the critical regionarrow_forward
- In one of the articles for review this week, Ondersma et al (2012) the researchers studied pretreatment change in pregnant women enrolled in substance abuse, In their research results they report the following: Wilcoxen signed rank value = −1140.5, p < .001 Interpreting these result (statement above), was there a statistically significant difference between the participants alcohol/drug use pre-treatment and first treatment?arrow_forwardThe authors of the paper "Statistical Methods for Assessing Agreement Between Two Methods of Clinical Measurement"† compared two different instruments for measuring a person's ability to breathe out air. (This measurement is helpful in diagnosing various lung disorders.) The two instruments considered were a Wright peak flow meter and a mini-Wright peak flow meter. Seventeen people participated in the study, and for each person air flow was measured once using the Wright meter and once using the mini-Wright meter. Subject Mini-WrightMeter WrightMeter Subject Mini-WrightMeter WrightMeter 1 512 494 10 445 433 2 430 395 11 432 417 3 520 516 12 626 656 4 428 434 13 260 267 5 500 476 14 477 478 6 600 557 15 259 178 7 364 413 16 350 423 8 380 442 17 451 427 9 658 650 (a) Suppose that the Wright meter is considered to provide a better measure of air flow, but the mini-Wright meter is easier to transport and to use. If the two types of meters produce…arrow_forward
arrow_back_ios
arrow_forward_ios
Recommended textbooks for you
- MATLAB: An Introduction with ApplicationsStatisticsISBN:9781119256830Author:Amos GilatPublisher:John Wiley & Sons Inc
 Probability and Statistics for Engineering and th...StatisticsISBN:9781305251809Author:Jay L. DevorePublisher:Cengage Learning
 Statistics for The Behavioral Sciences (MindTap C...StatisticsISBN:9781305504912Author:Frederick J Gravetter, Larry B. WallnauPublisher:Cengage Learning
  Elementary Statistics: Picturing the World (7th E...StatisticsISBN:9780134683416Author:Ron Larson, Betsy FarberPublisher:PEARSON
 The Basic Practice of StatisticsStatisticsISBN:9781319042578Author:David S. Moore, William I. Notz, Michael A. FlignerPublisher:W. H. Freeman
 Introduction to the Practice of StatisticsStatisticsISBN:9781319013387Author:David S. Moore, George P. McCabe, Bruce A. CraigPublisher:W. H. Freeman
MATLAB: An Introduction with Applications
Statistics
ISBN:9781119256830
Author:Amos Gilat
Publisher:John Wiley & Sons Inc
Probability and Statistics for Engineering and th...
Statistics
ISBN:9781305251809
Author:Jay L. Devore
Publisher:Cengage Learning
Statistics for The Behavioral Sciences (MindTap C...
Statistics
ISBN:9781305504912
Author:Frederick J Gravetter, Larry B. Wallnau
Publisher:Cengage Learning
Elementary Statistics: Picturing the World (7th E...
Statistics
ISBN:9780134683416
Author:Ron Larson, Betsy Farber
Publisher:PEARSON
The Basic Practice of Statistics
Statistics
ISBN:9781319042578
Author:David S. Moore, William I. Notz, Michael A. Fligner
Publisher:W. H. Freeman
Introduction to the Practice of Statistics
Statistics
ISBN:9781319013387
Author:David S. Moore, George P. McCabe, Bruce A. Craig
Publisher:W. H. Freeman