MATLAB: An Introduction with Applications
6th Edition
ISBN: 9781119256830
Author: Amos Gilat
Publisher: John Wiley & Sons Inc
expand_more
expand_more
format_list_bulleted
Question

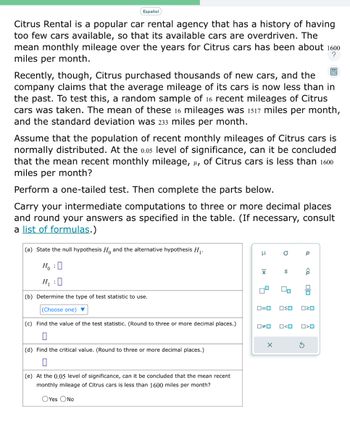
Transcribed Image Text:Español
Citrus Rental is a popular car rental agency that has a history of having
too few cars available, so that its available cars are overdriven. The
mean monthly mileage over the years for Citrus cars has been about 1600
miles per month.
?
Recently, though, Citrus purchased thousands of new cars, and the
company claims that the average mileage of its cars is now less than in
the past. To test this, a random sample of 16 recent mileages of Citrus
cars was taken. The mean of these 16 mileages was 1517 miles per month,
and the standard deviation was 233 miles per month.
Assume that the population of recent monthly mileages of Citrus cars is
normally distributed. At the 0.05 level of significance, can it be concluded
that the mean recent monthly mileage, μµ, of Citrus cars is less than 1600
miles per month?
Perform a one-tailed test. Then complete the parts below.
Carry your intermediate computations to three or more decimal places
and round your answers as specified in the table. (If necessary, consult
a list of formulas.)
(a) State the null hypothesis H and the alternative hypothesis H₁.
Ho
H₁ :0
(b) Determine the type of test statistic to use.
(Choose one) ▼
(c) Find the value of the test statistic. (Round to three or more decimal places.)
(d) Find the critical value. (Round to three or more decimal places.)
(e) At the 0.05 level of significance, can it be concluded that the mean recent
monthly mileage of Citrus cars is less than 1600 miles per month?
OYes ONO
3
|x
4
0#0
a
0=0 OSO
X
2
O<O
Р
3
<Q
P
Olo
ロマロ
O<O

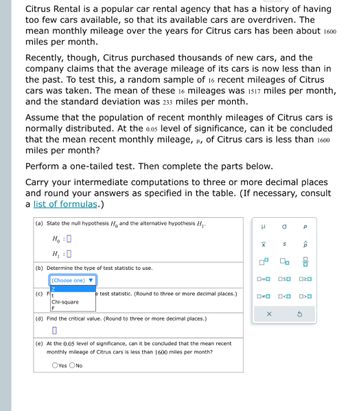
Transcribed Image Text:Citrus Rental is a popular car rental agency that has a history of having
too few cars available, so that its available cars are overdriven. The
mean monthly mileage over the years for Citrus cars has been about 1600
miles per month.
Recently, though, Citrus purchased thousands of new cars, and the
company claims that the average mileage of its cars is now less than in
the past. To test this, a random sample of 16 recent mileages of Citrus
cars was taken. The mean of these 16 mileages was 1517 miles per month,
and the standard deviation was 233 miles per month.
Assume that the population of recent monthly mileages of Citrus cars is
normally distributed. At the 0.05 level of significance, can it be concluded
that the mean recent monthly mileage, μ, of Citrus cars is less than 1600
miles per month?
Perform a one-tailed test. Then complete the parts below.
Carry your intermediate computations to three or more decimal places
and round your answers as specified in the table. (If necessary, consult
a list of formulas.)
(a) State the null hypothesis H and the alternative hypothesis H₁.
H₂ : O
H₁ :0
(b) Determine the type of test statistic to use.
(Choose one)
(c) F
Chi-square
e test statistic. (Round to three or more decimal places.)
F
(d) Find the critical value. (Round to three or more decimal places.)
(e) At the 0.05 level of significance, can it be concluded that the mean recent
monthly mileage of Citrus cars is less than 1600 miles per month?
OYes O No
μ
X
4
0#0
a
X
S
0=0 OSO
00
O<O
Р
p
S
ola
020
O<O
Expert Solution
This question has been solved!
Explore an expertly crafted, step-by-step solution for a thorough understanding of key concepts.
This is a popular solution
Trending nowThis is a popular solution!
Step by stepSolved in 6 steps with 1 images

Knowledge Booster
Similar questions
- In the 1980's it was believed that congenital abnormalities affected about 5.4% of the nation's children. Some people believe that an increase in the chemicals in the environment has led to an increase in the number of abnormalities. A recent study examined 400 randomly selected children and found that 29 of them showed signs of an abnormality. Does this provide evidence that the risk of congenital abnormalities has increase? Use a 0.05 to make your decision. What is the resulting test statistics?arrow_forwardA psychological study wants to analyze the relationship between anxiety and binge drinking; a questionnaire for anxiety and questionnaire for binge drinking is administered to each subject. What would be a good statistical test to test the hypothesis?arrow_forwardThe sample data here is the cholesterol levels for 10 men diagnosed with high cholesterol. The first row represents levels from 10 men who did not use the drug and the second row from 10 different men who did use the drug. If we want to test the claim that the mean level for all men who use the drug is less than the mean for all men who do not use it, what is the appropriate alternative hypothesis? The mean cholesterol level of males who take the medicine is higher than the mean cholesterol levels of men who do not take it. There is a significant difference between males who use the medicine and men who do not use the drug in terms of mean cholesterol levels. The mean cholesterol level of males who take the medicine is lower than the mean cholesterol levels of men who do not take it. There is no significant difference between males who use the medicine and men who do not use the drug in terms of mean cholesterol levels.arrow_forward
- If correlation does not imply causation, what does it imply?arrow_forwardIn a certain suburb, the mean house price in 2009 was $ 225,000. A real estate agent believes that the mean house price in that suburb has increased since 2009. Please state the null and alternative hypothesis.arrow_forwardA nationwide job recruiting firm wants to compare the annual incomes for childcare workers in Utah and Oregon. Due to recent trends in the childcare industry, the firm suspects that the mean annual income of childcare workers in Utah is less than the mean annual income of childcare workers in Oregon. To see if this is true, the firm selected a random sample of 20 childcare workers from Utah and an independent random sample of 20 childcare workers from Oregon and asked them to report their mean annual income. The data obtained were as follows. Annual income in dollars 27060 , 42320 , 36445 , 37895, 44564 , 35325 , 30313 , 28698, 33706 , 48365 , 26946 , 25063 , 28339 , 29265 , 40051 , 37026 , 40150 , 42753 , 27820, 39471 Utah 29769 , 48859 , 32480 , 36288,45102 , 46219 ,51098 , 45516 , 38834 , 44659 , 40755 , 38006 , 39947 , 29801 , 32200, 38731 , 41370 , 28059 , 33753 , 35271 Oregon Send data to calc... v Send data to Excel The population standard deviation for the annual incomes of…arrow_forward
- Please also explain why you determined whether or not the results are statistically significant. In another memory experiment, the mean scores for participants in Condition A and Condition B came out exactly the same!arrow_forwardThe Coca-Cola Company reported that the mean per capita annual sales of its beverages in the United States was 423 eight-ounce servings (Coca-Cola Company website, February 3, 2009). Suppose you are curious whether the consumption of Coca-Cola beverages is higher in Atlanta, Georgia, the location of Coca-Cola's corporate headquarters. A sample of 36 individuals from the Atlanta area showed a sample mean annual consumption of 460.4 eight-ounce servings with a standard deviation of s=101.9. Answer questions 8-10.arrow_forwardA clinical psychologist took a sample of four people from the population of people with anxiety disorders and gave them an interval-level anxiety scale. Their score were 57, 60, 67, and 68 with a mean of 63.00. What is s?arrow_forward
- You would like to be able to predict students' grade point averages based on the number of hours they study every week. You randomly select 500 students and have them report their GPA and number of hours they study per week. What statistical test will allow you to predict GPA based on the number of hours a student studies per week? And what is the research question?arrow_forwardOne personality test available on the World Wide Web has a subsection designed to assess the "honesty" of the test-taker. You are interested in the mean score, μ, among the general population on this subsection. The website reports that μ is 140, but you have good reason to believe that μ differs from 140. You decide to do a statistical test. You choose a random sample of people and have them take the personality test. You find that their mean score on the subsection is 146 and that the standard deviation of their scores is 22. Based on this information, complete the parts below. A. What are the null hypothesis H0 and the alternative hypothesis H1 that should be used for the test? H0: H1: B. Suppose you decide to reject the null hypothesis. Would you be making a type I or type II error?arrow_forward
arrow_back_ios
arrow_forward_ios
Recommended textbooks for you
 MATLAB: An Introduction with ApplicationsStatisticsISBN:9781119256830Author:Amos GilatPublisher:John Wiley & Sons Inc
 Probability and Statistics for Engineering and th...StatisticsISBN:9781305251809Author:Jay L. DevorePublisher:Cengage Learning
 Statistics for The Behavioral Sciences (MindTap C...StatisticsISBN:9781305504912Author:Frederick J Gravetter, Larry B. WallnauPublisher:Cengage Learning
 Elementary Statistics: Picturing the World (7th E...StatisticsISBN:9780134683416Author:Ron Larson, Betsy FarberPublisher:PEARSON
 The Basic Practice of StatisticsStatisticsISBN:9781319042578Author:David S. Moore, William I. Notz, Michael A. FlignerPublisher:W. H. Freeman
 Introduction to the Practice of StatisticsStatisticsISBN:9781319013387Author:David S. Moore, George P. McCabe, Bruce A. CraigPublisher:W. H. Freeman

MATLAB: An Introduction with Applications
Statistics
ISBN:9781119256830
Author:Amos Gilat
Publisher:John Wiley & Sons Inc

Probability and Statistics for Engineering and th...
Statistics
ISBN:9781305251809
Author:Jay L. Devore
Publisher:Cengage Learning

Statistics for The Behavioral Sciences (MindTap C...
Statistics
ISBN:9781305504912
Author:Frederick J Gravetter, Larry B. Wallnau
Publisher:Cengage Learning

Elementary Statistics: Picturing the World (7th E...
Statistics
ISBN:9780134683416
Author:Ron Larson, Betsy Farber
Publisher:PEARSON

The Basic Practice of Statistics
Statistics
ISBN:9781319042578
Author:David S. Moore, William I. Notz, Michael A. Fligner
Publisher:W. H. Freeman

Introduction to the Practice of Statistics
Statistics
ISBN:9781319013387
Author:David S. Moore, George P. McCabe, Bruce A. Craig
Publisher:W. H. Freeman