ENGR.ECONOMIC ANALYSIS
14th Edition
ISBN: 9780190931919
Author: NEWNAN
Publisher: Oxford University Press
expand_more
expand_more
format_list_bulleted
Question

Transcribed Image Text:$15
$14
$13
$12
$11
$10
$9
$8
$7
$6
$5
$4
$3
$2
$1
0
500
750
1,000
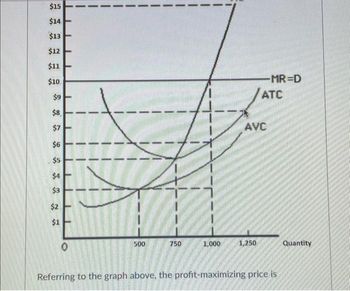
-MR=D
ATC
AVC
1,250
Referring to the graph above, the profit-maximizing price is
Quantity
Expert Solution
This question has been solved!
Explore an expertly crafted, step-by-step solution for a thorough understanding of key concepts.
This is a popular solution
Trending nowThis is a popular solution!
Step by stepSolved in 3 steps

Knowledge Booster
Learn more about
Need a deep-dive on the concept behind this application? Look no further. Learn more about this topic, economics and related others by exploring similar questions and additional content below.Similar questions
- The following graph plots the marginal cost (MC) curve, average total cost (ATC) curve, and average variable cost (AVC) curve for a firm operating in the competitive market for jumpsuits. COSTS (Dollars) 80 72 64 56 24 16 8 0 0 8 0 MC ATC AVC Price (Dollars per jumpsuit) 4 8 12 36 48 60 ■ 16 24 32 40 48 56 QUANTITY (Thousands of jumpsuits) ☐ Quantity (Jumpsuits) 64 For every price level given in the following table, use the graph to determine the profit-maximizing quantity of jumpsuits for the firm. Further, select whether the firm will choose to produce, shut down, or be indifferent between the two in the short run. (Assume that when price exactly equals average variable cost, the firm is indifferent between producing zero jumpsuits and the profit-maximizing quantity of jumpsuits.) Lastly, determine whether the firm will earn a profit, incur a loss, or break even at each price. 72 80 Produce or Shut Down? Profit or Loss?arrow_forwardPrice ($/slice) For the pizza seller whose marginal, average variable, and average total cost curves are shown in the graph below, what is the profit- maximizing level of output and how much profit will this producer earn if the price of pizza is $2.50 per slice? Instructions: In the graph below, label all three curves by clicking on the dropdown to select the appropriate label. Then, indicate the profit-maximizing level of output on the graph. 3.50 3.25 3.00 2.75 2.50 2.25 2.00 1.75 1.50 1.25 1.00 0.75 0.50 0.25 0 Cost Curves Tools -O Select ▼ Select ▼ Select ▼ Q* 100 200 300 400 500 600 700 800 900 Quantity (slices/day)arrow_forwardThe value = = 30.775 should be used in the cost model to estimate the cost of producing how many widgets? widgets. Round to the nearest widget.arrow_forward
- Discuss economies of scale and how average cost changes as output increases. What pricing strategy should a firm adopt while they are experiencing economies of scale? 250 words pleasearrow_forward(Please attempt thus question if you will provide Solution for both questions below...thanks) 1) If a firm wanted to reduce the annual EOQ cost as a percentage of the annual purchase cost by 50 percent, how would the demand rate have to change? A) Decrease by 50 percent. B) Remain unchanged. C) Increase by 50 percent. D) Double. E) Quadruple. Select correct option and explain answer with Calculation. 2) A firm evaluates its EOQ quantity to equal 180 cases, but it chooses an order quantity of 200 cases. Relative to the order quantity of 180 cases, the order quantity of 200 cases has A) higher ordering cost and higher holding cost. B) higher ordering cost and lower holding cost. C) lower ordering cost and higher holding cost D) lower ordering cost and lower holding cost.arrow_forwardThe inverse demand for tea is given by P= 10 – 0.04Q, where Pis the price per a gram of tea and Qis the total number of grams of tea brought to market. There are two tea shops in the market. Shop 1's cost function is given by C = 0.01q,?, where qı is the number of grams of tea it brings to market. Shop 2's cost function is given by C2 = 0.01q2², where qp is the number of grams of tea it brings to market. Given that the two shops compete by setting output (Cournot), answer the following. a) Identify shop 1's reaction function to shop 2's output to within 2 decimal places (e.g. 0.33). 91= Number - Number 92 b) Identify shop 2's reaction function to shop 1's output to within 2 decimal places (e.g. 0.71). q2= Number Number 91 c) To within two decimal places (e.g. 0.63) what is the equilibrium output level of each shop and the equilibrium per gram price for tea. Shop 1 will produce Number grams of tea and shop 2 will produce Number grams of tea. The equilibrium market price is £ Numberarrow_forward
arrow_back_ios
arrow_forward_ios
Recommended textbooks for you

 Principles of Economics (12th Edition)EconomicsISBN:9780134078779Author:Karl E. Case, Ray C. Fair, Sharon E. OsterPublisher:PEARSON
 Engineering Economy (17th Edition)EconomicsISBN:9780134870069Author:William G. Sullivan, Elin M. Wicks, C. Patrick KoellingPublisher:PEARSON
 Principles of Economics (MindTap Course List)EconomicsISBN:9781305585126Author:N. Gregory MankiwPublisher:Cengage Learning
 Managerial Economics: A Problem Solving ApproachEconomicsISBN:9781337106665Author:Luke M. Froeb, Brian T. McCann, Michael R. Ward, Mike ShorPublisher:Cengage Learning
 Managerial Economics & Business Strategy (Mcgraw-...EconomicsISBN:9781259290619Author:Michael Baye, Jeff PrincePublisher:McGraw-Hill Education


Principles of Economics (12th Edition)
Economics
ISBN:9780134078779
Author:Karl E. Case, Ray C. Fair, Sharon E. Oster
Publisher:PEARSON

Engineering Economy (17th Edition)
Economics
ISBN:9780134870069
Author:William G. Sullivan, Elin M. Wicks, C. Patrick Koelling
Publisher:PEARSON

Principles of Economics (MindTap Course List)
Economics
ISBN:9781305585126
Author:N. Gregory Mankiw
Publisher:Cengage Learning

Managerial Economics: A Problem Solving Approach
Economics
ISBN:9781337106665
Author:Luke M. Froeb, Brian T. McCann, Michael R. Ward, Mike Shor
Publisher:Cengage Learning

Managerial Economics & Business Strategy (Mcgraw-...
Economics
ISBN:9781259290619
Author:Michael Baye, Jeff Prince
Publisher:McGraw-Hill Education