
ENGR.ECONOMIC ANALYSIS
14th Edition
ISBN: 9780190931919
Author: NEWNAN
Publisher: Oxford University Press
expand_more
expand_more
format_list_bulleted
Related questions
Question
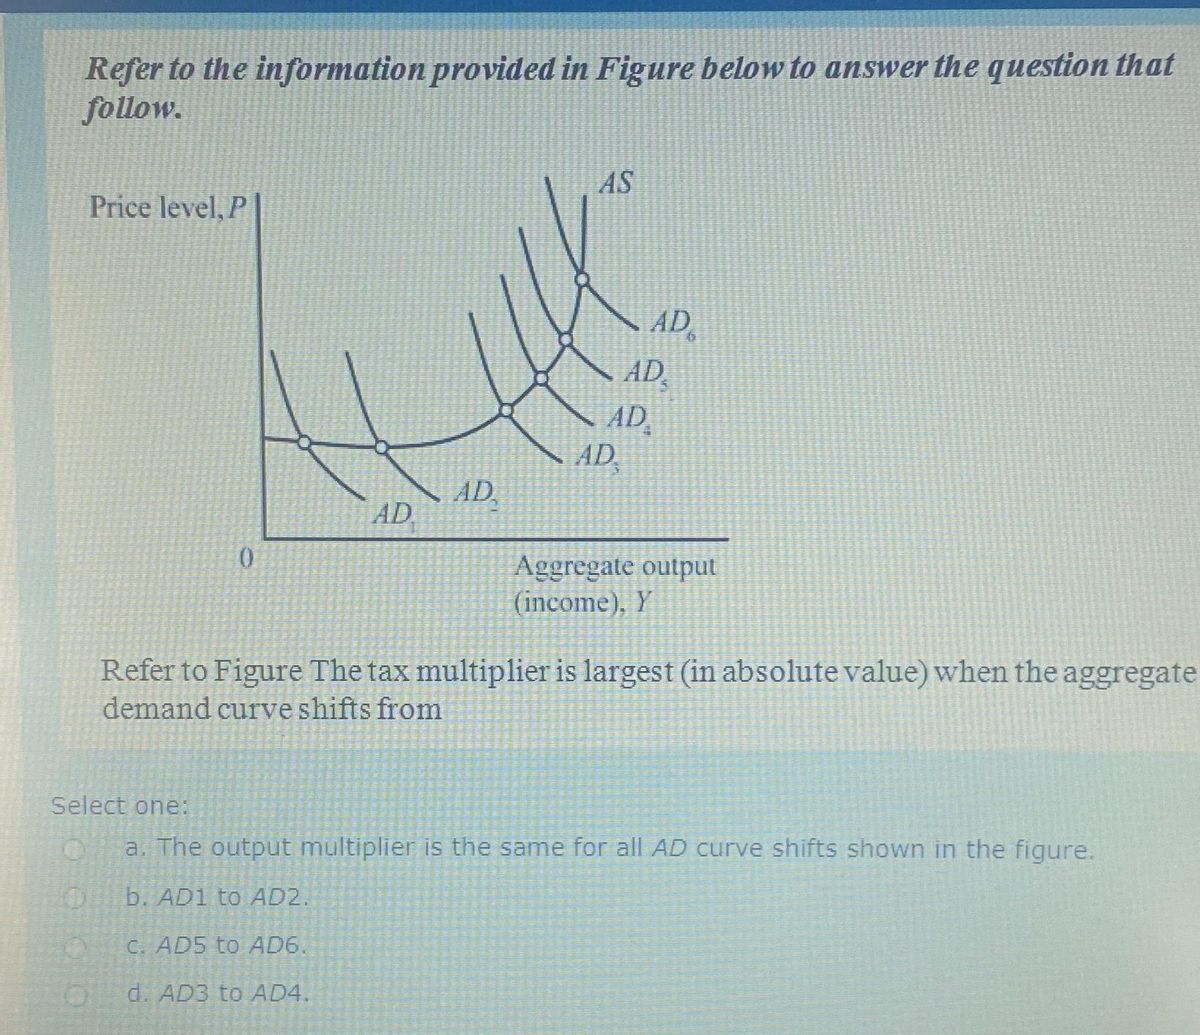

Transcribed Image Text:Refer to the information provided in Figure below to answer the question that
follow.
Price level, P
0
AD
AD,
AS
AD
AD
AD
ADS
Aggregate output
(income), Y
Refer to Figure The tax multiplier is largest (in absolute value) when the aggregate
demand curve shifts from
Select one:
a. The output multiplier is the same for all AD curve shifts shown in the figure.
b. AD1 to AD2.
c. AD5 to AD6.
d. AD3 to AD4.
Expert Solution
This question has been solved!
Explore an expertly crafted, step-by-step solution for a thorough understanding of key concepts.

Step by stepSolved in 4 steps

Knowledge Booster


Learn more about
Need a deep-dive on the concept behind this application? Look no further. Learn more about this topic, economics and related others by exploring similar questions and additional content below.Similar questions
- Refer to the Figure. If the economy is at point N on the curve, then a decrease in the tax rate will increase the deadweight loss of the tax and decrease tax revenue. decrease the deadweight loss of the tax and decrease tax revenue. increase the deadweight loss of the tax and increase tax revenue. decrease the deadweight loss of the tax and increase tax revenue. Note:- Do not provide handwritten solution. Maintain accuracy and quality in your answer. Take care of plagiarism. Answer completely. You will get up vote for sure.arrow_forwardAssume that a hypothetical economy with an MPC of 0.75 is experiencing severe recession. Instructions: In part a, round your answers to 2 decimal places. Enter positive numbers. In part b, enter your answers as whole numbers. a. By how much would government spending have to rise to shift the aggregate demand curve rightward by $40 billion? $ billion. How large a tax cut would be needed to achieve the same increase in aggregate demand? $ billion. b. Determine one possible combination of government spending increases and tax increases that would accomplish the same goal without changing the amount of outstanding debt (because it maintains a balanced budget, G = T). Increase spending by $ billion. Increase taxes by $ billion.arrow_forwardAssuming that the economy shown in the figure below is in equilibrium, calculate the recessionary or inflationary gap in each case below. AS 350 AD 300 250 200 150 100 50 100 200 300 400 500 600 700 800 900 1000 Real GDP a. Potential GDP (LAS) is $300 then there is a(n) (Click to select) ♥ gap of $ (Click to select) b. Potential GDP (LAS) is $600 then there is a(n) inflationary recessionary Įgap of $ c. Potential GDP (LAS) is $750 then there is a(n) (Click to select) v gap of $ Price indexarrow_forward
- Section 2 - Exercises Exercise 1: Automatic stabilisers Assume a closed economy (no import or export) characterised by the following equations describing the behaviour of aggregate demand: Consumption function: C = Co + C₁ (YT) T = to +t₁Y [Taxation rule] Investment and government spending are assumed to be constant: I = I and G = G Where co is autonomous consumption, tå is autonomous taxation, c₁ = 0.6 is the marginal propensity to consume, t₁ = 0.2 is the sensitivity of tax revenues to income. a) Explain why it is reasonable to assume that government tax revenues would respond to changes in income. b) Solve for the equilibrium output in the goods market. c) What is the Keynesian multiplier in this economy? How is it related to the parameters of the model. d) Assume autonomous consumption co falls by £1 Billion. Calculate the change in equilibrium output. e) Represent the effect of the shock on a Keynesian cross diagram. f) Complete the table below and explain in words how the…arrow_forwardExhibit 24-1 shows the short run and long run equilibrium in an aggregate demand-aggregate supply model. If the economy is initially at point G which of the following changes will most likely be observed when a contractionary fiscal policy is adopted? a) The SRAS curve will shift to the left b) Real GDP will increase above Y2 c)The aggregate demand curve will shift from AD** to AD d)The LRAS curve will shift to the rightarrow_forwardConsider a hypothetical closed economy in which the marginal propensity to consume (MPC) is 0.8 and taxes do not vary with income (that is, taxes are fixed rather than variable and the income tax rate = 0). The following graph shows the aggregate demand curves (AD and AD₂), the short-run aggregate supply (AS) curve, and the long-run aggregate supply curve at the potential GDP level. The economy is currently at point A. PRICE LEVEL 128 ལྕ་སྐྱ་སྐྱ་སྐྱ་རྩ་སྐྱ 124 120 A 116 112 108 200 300 400 Potential GDP AS124 AD₂ AD₁ 500 600 700 800 900 1000 REAL GDP (Billions of dollars) The economy is currently experiencing a recessionary gap of $100 billion. To close this gap, one option would be for the government to increase not change). government purchases by $20 billion (assuming net taxes do If the government kept its purchases constant, it could also close the gap by (Hint: In this case, since taxes do not vary with income, the formula for the multiplier for a change in fixed taxes is net…arrow_forward
- In an effort to increase output in the short run due to the poor economy, government officials have decided to cut taxes. They are considering two possible temporary tax cuts of equal size in terms of lost revenue. The first would reduce the taxes on people with incomes above $100,000 per year. The second would cut taxes on people with incomes below $60,000 for one year. Which change would have a greater impact on aggregate spending (i.e shift the aggregate demand curve further to the right)? Why?arrow_forwardAssume that the Marginal Propensity to Consume (MPC) is 0.8. If the multiplier effect is taken into account, the reduction in government expenditure by $ 200 million will shift the overall demand process to the correct order below. A) right, $1,000 million B) left, $ 200 million C) left, $160 million D) left, $1,000 million E) right, $ 160 millionarrow_forwardUsing the Aggregate Supply -Aggregate Demand model describe both the short run and the long run effects of a reduction in corporation tax for an economy currently producing at their potential GDP level.arrow_forward
- From the perspective of someone using aggregate-demand and aggregate supplyanalysis, what is the impact of a tax cut when the economy is operating above fullemployment. Is this a wise policy? Why or why not?arrow_forwardSolve question no. 2 which is shaded.Hand written solutions are strictly prohibitedarrow_forwardsupply equation is Y - Ypot + 80 (P-Pe), where Ypot is the potential level of output. In 2016, the population was 400 million, and the structure of the economy was described by the following equations for household consumption behavior and taxes received: C = 100+ 0.8DI, and T = 0. where all monetary values are in billions of dollars. Government spending was fixed at $1700 billion, and firm's investment behavior was fixed at $800 billion. Trading is allowed in this economy and in 2016, trading occurred such that the trade account was balanced. That is, net exports (X-IM) was equal to zero. (Question 15 of 20) Now consider that in in the following year (2017), the government decided to implement a policy aimed at moving the economy to full employment. In its decision to move the economy to full employment, they used government spending as the policy tool. The structure and fixed spending behaviors remain the same as they were in 2016, except for government spending. In addition, changes…arrow_forward
arrow_back_ios
SEE MORE QUESTIONS
arrow_forward_ios
Recommended textbooks for you
 Principles of Economics (12th Edition)EconomicsISBN:9780134078779Author:Karl E. Case, Ray C. Fair, Sharon E. OsterPublisher:PEARSON
 Engineering Economy (17th Edition)EconomicsISBN:9780134870069Author:William G. Sullivan, Elin M. Wicks, C. Patrick KoellingPublisher:PEARSON
 Principles of Economics (MindTap Course List)EconomicsISBN:9781305585126Author:N. Gregory MankiwPublisher:Cengage Learning
 Managerial Economics: A Problem Solving ApproachEconomicsISBN:9781337106665Author:Luke M. Froeb, Brian T. McCann, Michael R. Ward, Mike ShorPublisher:Cengage Learning
 Managerial Economics & Business Strategy (Mcgraw-...EconomicsISBN:9781259290619Author:Michael Baye, Jeff PrincePublisher:McGraw-Hill Education
Principles of Economics (12th Edition)
Economics
ISBN:9780134078779
Author:Karl E. Case, Ray C. Fair, Sharon E. Oster
Publisher:PEARSON
Engineering Economy (17th Edition)
Economics
ISBN:9780134870069
Author:William G. Sullivan, Elin M. Wicks, C. Patrick Koelling
Publisher:PEARSON
Principles of Economics (MindTap Course List)
Economics
ISBN:9781305585126
Author:N. Gregory Mankiw
Publisher:Cengage Learning
Managerial Economics: A Problem Solving Approach
Economics
ISBN:9781337106665
Author:Luke M. Froeb, Brian T. McCann, Michael R. Ward, Mike Shor
Publisher:Cengage Learning
Managerial Economics & Business Strategy (Mcgraw-...
Economics
ISBN:9781259290619
Author:Michael Baye, Jeff Prince
Publisher:McGraw-Hill Education