ENGR.ECONOMIC ANALYSIS
14th Edition
ISBN: 9780190931919
Author: NEWNAN
Publisher: Oxford University Press
expand_more
expand_more
format_list_bulleted
Question


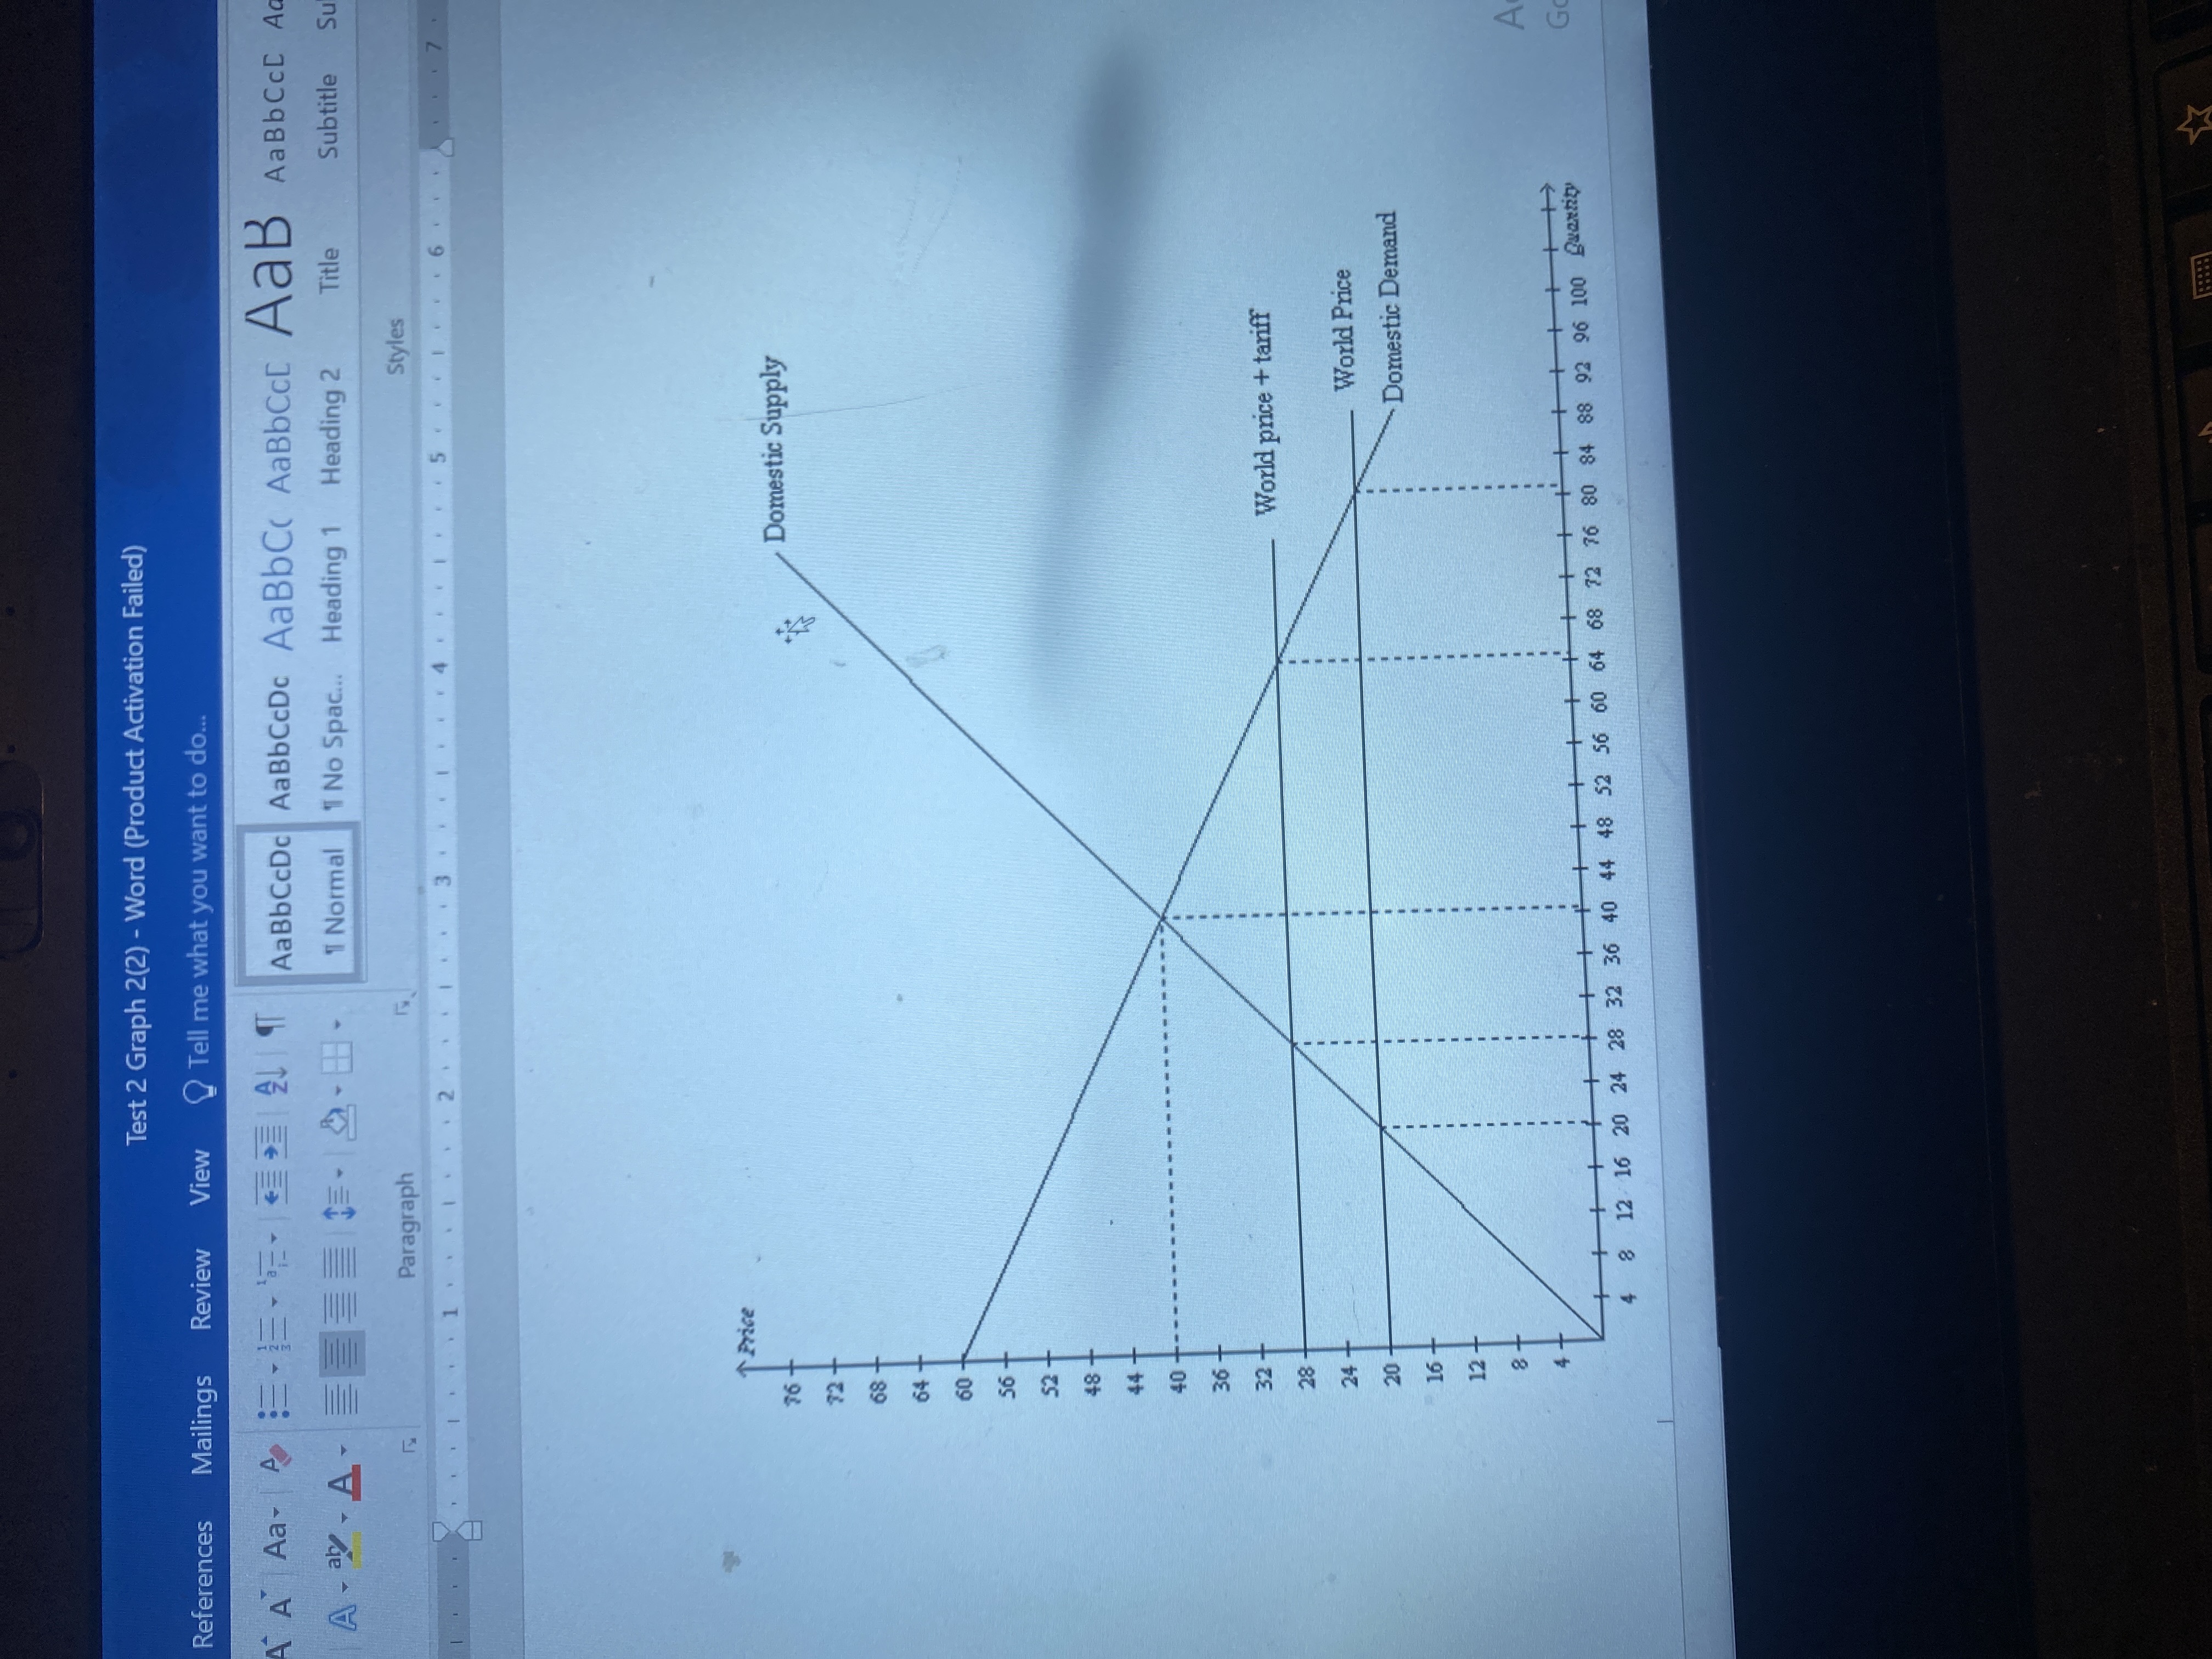
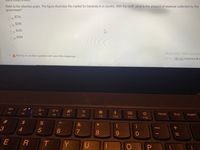
Transcribed Image Text:Refer to the attached graph. The figure illustrates the market for bananas in a country. With the tariff, what is the amount of revenue collected by the
government?
$734
a.
Ob.
Ob. $288
Oc $200
C.
$368
Od.
Activate Windows
» A Moving to another question will save this response.
Go to SetirgisQuestion 6 c
F3
F4
F5
Home
End
Insert
F6
F7
F8
F9
F10
F11
F12
%23
&
C
3
4
5
7
8.
0
%3D
E
T
Y
P
{
+ II
Expert Solution
This question has been solved!
Explore an expertly crafted, step-by-step solution for a thorough understanding of key concepts.
This is a popular solution
Trending nowThis is a popular solution!
Step by stepSolved in 3 steps with 2 images

Knowledge Booster
Learn more about
Need a deep-dive on the concept behind this application? Look no further. Learn more about this topic, economics and related others by exploring similar questions and additional content below.Similar questions
- Only typed answer and please answer correctlyarrow_forwardAplia HU ipdns pue pu 2. Elasticity and total revenue The following graph shows the daily demand curve for bippitybops in Miami. Use the green rectangle (triangle symbols) to compute total revenue at various prices along the demand curve. Note: You will not be graded on any changes made to this graph. 240 220 200 Total Revenue 180 160 140 120 100 80 60 40 20 Demand 6. 12 15 18 21 24 27 30 33 36 QUANTITY (Bippitybops per day) PRICE (Dollars per bippitybop)arrow_forwardFinal Exam (4 HR) (page 24 of 26) - Google Chrome mpuslife.ca/Ims/mod/quiz/attempt.php?attempt-6982998cmid=14397319&page=23 The demand schedule for sugar is: 24°C The demand schedule for sugar is: Price (dollars per kilogram) 3 5 9 12 Quantity Demanded (millions of kilograms per year) 20 Paragraph a. What happens to total revenue if the price of sugar rises from $3 to $7 per kile c. At what price is total revenue a maximum? 16 12 b. What happens to total revenue if the price rises from $7 to $12? BIEE 3 2arrow_forward
- Please helparrow_forwardRefer to the figure and table to answer the following questions: Price (dollars per ounce) 0.50 0.45 0.40 0.35 0.30 2 0.25 0.20 0.15 0.10 0.05 ABCDEFG с H J A B с Point H to | = D E F G Price (per Ounce) $0.50 0.45 0.40 0.35 0.30 0.25 0.20 0.15 0.10 0.05 H 0 2 4 6 8 10 12 14 16 18 20 22 24 26 28 30 Quantity Demanded (ounces per show) 21 Quantity Demanded (Ounces per Show) 1 2 4 6 9 12 16 20 25 30 Instructions: In part a, round your responses to one decimal place. In part b, round your responses to two decimal places. a. Compute the price elasticity between points C and D and points H and I. Point C to D = b. Compute the total revenue at points C, D, H, and I. At point C = $ At point D = $ At point H = $ At point I = $ c. If there is a price decrease, total revenue will increase when demand is (Click to select)arrow_forwardWhat are the factors affecting the demand for air travel within the United States?arrow_forward
- img' (a If po increases, what happens to the demand and supply of public transportation (shifts left/shifts right/doesn’t change) What happens to the equilibrium quantity and price for public transportation? (increase/decrease) (b)At a given price p, as oil becomes more expensive (po increases), does the (own) price elasticity of demand for public transportation increase / decrease / stay the same? (c) Calculate the cross-price elasticity of public transportation demand with respect to the oil price po, at the point p = 1 and po = 2. Are the two goods (public transportation and oil) substitutes or complements, or unrelated?arrow_forwardal E G answer 201-R C Use the Chris B Chris B Checko Ticket New T M You Ge ah Search Question 13 0/48 answered Please review the graph below containing a demand curve for hammocks. Between point B and C, using the midpoint formula, the elasticity coefficient is: $140 $120 $100 $80 $60 $40 $20 Selected answer will be automatically saved. For keyboard navigation, press up/down arrow keys to select an answer. a 0.25 b 4.0 10 C 0.40 d 0.10 Question 14 Time Rema Demand 50 100 150 200 250 300 350 Quantity of Hammocks Demanded 口 ធarrow_forwardThe graph shows the schedule for hours of tutoring in economics. If the price increases from equilibrium at $10 to $15, total surplus for the market will decrease by, in numerals, $_____. Please type the correct answer in the following input field, and then select the submit answer button or press the enter key when finished. Your answer:arrow_forward
- What Type of attraction are in Uk? and which are the main Characteristcs of supply? (what make different from the rest of the world)arrow_forwardOnly Typing answer I need ASAP Please do it ASAParrow_forwardBased on this graph,Calculate the total revenue from 200 pairs of shoes if there is a price ceiling.arrow_forward
arrow_back_ios
SEE MORE QUESTIONS
arrow_forward_ios
Recommended textbooks for you

 Principles of Economics (12th Edition)EconomicsISBN:9780134078779Author:Karl E. Case, Ray C. Fair, Sharon E. OsterPublisher:PEARSON
 Engineering Economy (17th Edition)EconomicsISBN:9780134870069Author:William G. Sullivan, Elin M. Wicks, C. Patrick KoellingPublisher:PEARSON
 Principles of Economics (MindTap Course List)EconomicsISBN:9781305585126Author:N. Gregory MankiwPublisher:Cengage Learning
 Managerial Economics: A Problem Solving ApproachEconomicsISBN:9781337106665Author:Luke M. Froeb, Brian T. McCann, Michael R. Ward, Mike ShorPublisher:Cengage Learning
 Managerial Economics & Business Strategy (Mcgraw-...EconomicsISBN:9781259290619Author:Michael Baye, Jeff PrincePublisher:McGraw-Hill Education


Principles of Economics (12th Edition)
Economics
ISBN:9780134078779
Author:Karl E. Case, Ray C. Fair, Sharon E. Oster
Publisher:PEARSON

Engineering Economy (17th Edition)
Economics
ISBN:9780134870069
Author:William G. Sullivan, Elin M. Wicks, C. Patrick Koelling
Publisher:PEARSON

Principles of Economics (MindTap Course List)
Economics
ISBN:9781305585126
Author:N. Gregory Mankiw
Publisher:Cengage Learning

Managerial Economics: A Problem Solving Approach
Economics
ISBN:9781337106665
Author:Luke M. Froeb, Brian T. McCann, Michael R. Ward, Mike Shor
Publisher:Cengage Learning

Managerial Economics & Business Strategy (Mcgraw-...
Economics
ISBN:9781259290619
Author:Michael Baye, Jeff Prince
Publisher:McGraw-Hill Education