
MATLAB: An Introduction with Applications
6th Edition
ISBN: 9781119256830
Author: Amos Gilat
Publisher: John Wiley & Sons Inc
expand_more
expand_more
format_list_bulleted
Related questions
Concept explainers
Topic Video
Question

Transcribed Image Text:Question Help ▼
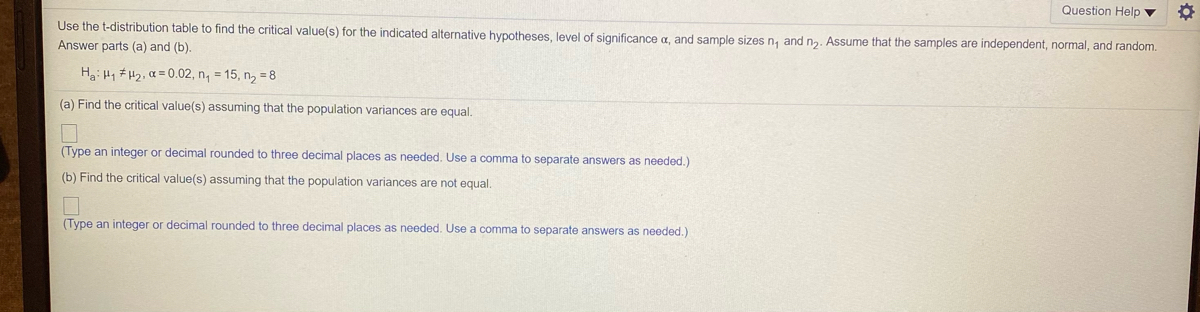
Use the t-distribution table to find the critical value(s) for the indicated alternative hypotheses, level of significance a, and sample sizes n, and n2. Assume that the samples are independent, normal, and random.
Answer parts (a) and (b).
Ha: Hy # H2, a = 0.02, n, = 15, n, = 8
(a) Find the critical value(s) assuming that the population variances are equal.
(Type an integer or decimal rounded to three decimal places as needed. Use a comma to separate answers as needed.)
(b) Find the critical value(s) assuming that the population variances are not equal.
(Type an integer or decimal rounded to three decimal places as needed. Use a comma to separate answers as needed.)
Expert Solution
arrow_forward
Step 1
(a)
Obtain the critical value when the population variances are equal.
The critical value is obtained below as follows :

Given the tail of the test is two tailed.
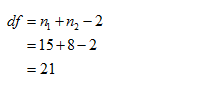
The degrees of freedom is obtained below as follows:
Use EXCEL Procedure for finding the critical value of t.
Follow the instruction to obtain the critical value of t:
- Open EXCEL
- Go to Formula bar.
- In formula bar enter the function as“=TINV”
- Enter the probability as 0.02.
- Enter the degrees of freedom as 21.
- Click enter
EXCEL output:
From the EXCEL output, the critical value of t at 0.02 level of significance with the 21 degrees of freedom is 2.518.
Thus, the critical values are(–2.518, 2.518).

Step by stepSolved in 2 steps with 4 images

Knowledge Booster


Learn more about
Need a deep-dive on the concept behind this application? Look no further. Learn more about this topic, statistics and related others by exploring similar questions and additional content below.Similar questions
- We have provided a distribution and the observed frequencies of the values of a variable from a simple random sample of a population. In each case, use the chi-square goodness-of-fit test to decide, at the specified significance level, whether the distribution of the variable differs from the given distribution. Distribution: 0.2, 0.1, 0.1, 0.3, 0.3 Observed frequencies: 29, 13, 5, 25, 28 Significance level = 0.10arrow_forwardPlease see below. I need help with this.arrow_forwardHW10Q9arrow_forward
- Drug Trial ProblemClinical trials for a drug was conducted using a treatment group and a placebo group. The results are shown in the table below. Treatment Placebo μ μ₁ μ₂ n 33 38 x̄ 2.31 2.87 s 0.85 0.71 Use a 0.05 significance level to test the claim that the two samples are from populations with different means. State the final conclusion regarding the claim (using p-value). ______________ the HO since the p-value is __________ the significance level α.arrow_forwardTextbook: Statistics for the Behavioral SciencesGregory J. Privitera Please show your work-Concept and Application Problems (Pg.133) An expert reviews a sample of 10 scientific articles (n = 10) and records the following number of errors in each article: 2, 9, 2, 8, 2, 3, 1, 0, 5, and 7. Compute the SS, variance, and standard deviation for this sample using the definitional and computational formula.arrow_forwardGiven the population mean hypothesis H0: μ = 150 and H1: μ ≠ 150 identify the the type of test distribution. (A) Right-tail test (B) Two-tail test (C) Left-tail test (D) None of thesearrow_forward
- Question Help ▼ Test the claim about the difference between two population means u, and u, at the level of significance a. Assume the samples are random and independent, and t populations are normally distributed. Claim: µ, sH2; a = 0.05. Assume o, #o Sample statistics: X, = 2420, s, = 170, n, = 13 and X, = 2296, s, = 50, n, = 10 Identify the null and alternative hypotheses. Choose the correct answer belew. O A. Ho: H1 SH2 O B. Ho: H1 H2 O F. Ho: H1 = H2 Ha: H1 SH2 Ha: H1 # H2 Find the standardized test statistic t. t3= (Round to two decimal places as needed.) Find the P-value. P = (Round to three decimal places as needed.) Click to select your answer(s).arrow_forwardConstructed Response Question 2 A teacher claims that their students are missing more than 10% of the assignments for the third quarter. We take a random sample of 25 students and see that 12% of their assignments are missing. Using a = 0.05, can we support the teacher's claim? Perform a normal distribution rejection region hypothesis test for proportions. Show all seven steps.arrow_forwardFind the critical value(s) and rejection region(s) for the indicated t-test, level of significance a, and sample size n. Left tailed test, a=0.10, n=26 The critical value is/are? Determine the rejection regions?arrow_forward
arrow_back_ios
arrow_forward_ios
Recommended textbooks for you
- MATLAB: An Introduction with ApplicationsStatisticsISBN:9781119256830Author:Amos GilatPublisher:John Wiley & Sons Inc
 Probability and Statistics for Engineering and th...StatisticsISBN:9781305251809Author:Jay L. DevorePublisher:Cengage Learning
 Statistics for The Behavioral Sciences (MindTap C...StatisticsISBN:9781305504912Author:Frederick J Gravetter, Larry B. WallnauPublisher:Cengage Learning
  Elementary Statistics: Picturing the World (7th E...StatisticsISBN:9780134683416Author:Ron Larson, Betsy FarberPublisher:PEARSON
 The Basic Practice of StatisticsStatisticsISBN:9781319042578Author:David S. Moore, William I. Notz, Michael A. FlignerPublisher:W. H. Freeman
 Introduction to the Practice of StatisticsStatisticsISBN:9781319013387Author:David S. Moore, George P. McCabe, Bruce A. CraigPublisher:W. H. Freeman
MATLAB: An Introduction with Applications
Statistics
ISBN:9781119256830
Author:Amos Gilat
Publisher:John Wiley & Sons Inc
Probability and Statistics for Engineering and th...
Statistics
ISBN:9781305251809
Author:Jay L. Devore
Publisher:Cengage Learning
Statistics for The Behavioral Sciences (MindTap C...
Statistics
ISBN:9781305504912
Author:Frederick J Gravetter, Larry B. Wallnau
Publisher:Cengage Learning
Elementary Statistics: Picturing the World (7th E...
Statistics
ISBN:9780134683416
Author:Ron Larson, Betsy Farber
Publisher:PEARSON
The Basic Practice of Statistics
Statistics
ISBN:9781319042578
Author:David S. Moore, William I. Notz, Michael A. Fligner
Publisher:W. H. Freeman
Introduction to the Practice of Statistics
Statistics
ISBN:9781319013387
Author:David S. Moore, George P. McCabe, Bruce A. Craig
Publisher:W. H. Freeman