MATLAB: An Introduction with Applications
6th Edition
ISBN: 9781119256830
Author: Amos Gilat
Publisher: John Wiley & Sons Inc
expand_more
expand_more
format_list_bulleted
Question
Question 1
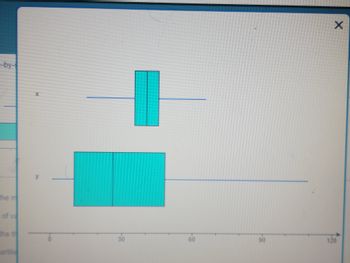
What is the median of variable x?
The median of variable x is
(Round to the nearest integer as needed.)
What is the third quartile of variable y?
The third quartile of variable y is
(Round to the nearest integer as needed.)
Question 2
Which variable has more dispersion? Why?
Question 3
Describe the shape of the variable x. Support your position.
Describe the shape of the variable y. Support your position

Transcribed Image Text:of va
artile
y
30
60
90
X
Expert Solution
arrow_forward
Step 1
X lies between ( 45 to 55)
Y lies between (10, 50)
Step by stepSolved in 3 steps

Knowledge Booster
Similar questions
- Eyeglassomatic manufactures eyeglasses for different retailers. They test to see how many defective lenses they made the time period of January 1 to March 31. The table gives the defect and the number of defects. Do the data support the notion that each defect type occurs in the same proportion? Test at the 5% level. Number of Defective Lenses Defect type Number of defects Scratch 1866 Right shaped - small 1935 Flaked 1979 Wrong axis 1921 Chamfer wrong 1864 Crazing, cracks 1991 Wrong shape 2004 Wrong PD 1895 Spots and bubbles 1917 Wrong height 1885 Right shape - big 1875 Lost in lab 1886 Spots/bubble - intern 1935 State the hypotheses.H0: Each defect type in the same proportion.Ha: Each defect type in the same proportion. Calculate the χ2 test statistic. Round expected values to two decimal places. Round χ2 to three decimal places.χ2 = Calculate the p-value. Round to four decimal places.p-value = State your decision.Since p-value 0.05,…arrow_forwardNormal No Spacing Heading 1 A Paragraph Styles Font 2. Consider the boxplots below and answer the questions that follow. Boxplots of Data Sets A and B A 10 15 20 25 30 35 40 Values a. Which data set has the larger range? b. Circle all outliers. c. What is the value of the median for data set B (approximately)? d. What is the value of the first quartile for data set A (approximately)? e. Which data set has the larger interquartile range (IQR)? f. About 75% of data set B lies below what value? Preditions: On Accessibility: Investigate O Focus 10 fg ho prt sc 1 & * 8. 00arrow_forwardProvided below is a simple data set for you to practice finding descriptive measures. For the data set, complete parts (a) through (c). 0, 1, 3, 5, 6, 0, 1, 3,5,6 a. Obtain the quartiles. Q₁ = ad Q₂ Q3 (Type integers or decimals. Do not round.) b. Determine the interquartile range. The interquartile range is (Type an integer or a decimal. Do not round.) 11 c. Find the five-number summary. 100000 (Type integers or decimals. Do not round. Use ascending order.)arrow_forward
- The histogram describes the height of students in a math class. Is the data univariate or bivariate? Is the skewness left, right, or normal?arrow_forwardFind the three measures of central tendency (the mean, median, and mode). (If an anewer does not exist, enter DNE.) 0, 1, 1, 2, 3, 4, 12, 33 mean median mode Need Help? Read R Additional Materialsarrow_forwardWhich of the following must be entries from the original data set? the mode the range the third quartile the median the maximumarrow_forward
- A medical researcher measures the increase in heart rate of patients who are taking a stress test. What kind of variable is the researcher studying? Choose the correct answer below. Identifier variable Ordinal variable Categorical variable Quantitative variablearrow_forwardWhat is the best description of the shape of the data below? Bell-shaped Skewed right Skewed leftarrow_forwardHelp please week 7arrow_forward
arrow_back_ios
SEE MORE QUESTIONS
arrow_forward_ios
Recommended textbooks for you
 MATLAB: An Introduction with ApplicationsStatisticsISBN:9781119256830Author:Amos GilatPublisher:John Wiley & Sons Inc
 Probability and Statistics for Engineering and th...StatisticsISBN:9781305251809Author:Jay L. DevorePublisher:Cengage Learning
 Statistics for The Behavioral Sciences (MindTap C...StatisticsISBN:9781305504912Author:Frederick J Gravetter, Larry B. WallnauPublisher:Cengage Learning
 Elementary Statistics: Picturing the World (7th E...StatisticsISBN:9780134683416Author:Ron Larson, Betsy FarberPublisher:PEARSON
 The Basic Practice of StatisticsStatisticsISBN:9781319042578Author:David S. Moore, William I. Notz, Michael A. FlignerPublisher:W. H. Freeman
 Introduction to the Practice of StatisticsStatisticsISBN:9781319013387Author:David S. Moore, George P. McCabe, Bruce A. CraigPublisher:W. H. Freeman

MATLAB: An Introduction with Applications
Statistics
ISBN:9781119256830
Author:Amos Gilat
Publisher:John Wiley & Sons Inc

Probability and Statistics for Engineering and th...
Statistics
ISBN:9781305251809
Author:Jay L. Devore
Publisher:Cengage Learning

Statistics for The Behavioral Sciences (MindTap C...
Statistics
ISBN:9781305504912
Author:Frederick J Gravetter, Larry B. Wallnau
Publisher:Cengage Learning

Elementary Statistics: Picturing the World (7th E...
Statistics
ISBN:9780134683416
Author:Ron Larson, Betsy Farber
Publisher:PEARSON

The Basic Practice of Statistics
Statistics
ISBN:9781319042578
Author:David S. Moore, William I. Notz, Michael A. Fligner
Publisher:W. H. Freeman

Introduction to the Practice of Statistics
Statistics
ISBN:9781319013387
Author:David S. Moore, George P. McCabe, Bruce A. Craig
Publisher:W. H. Freeman