MATLAB: An Introduction with Applications
6th Edition
ISBN: 9781119256830
Author: Amos Gilat
Publisher: John Wiley & Sons Inc
expand_more
expand_more
format_list_bulleted
Question
thumb_up100%
Which type of analysis would you run to answer the question.
eg. Chi square goodness of fit, one sample t test
no need to run actual analysis simply choose and explain why

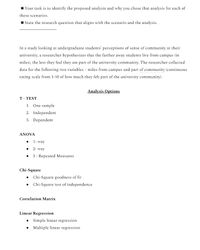
Transcribed Image Text:Your task is to identify the proposed analysis and why you chose that analysis for each of
these scenarios.
State the research question that aligns with the scenario and the analysis.
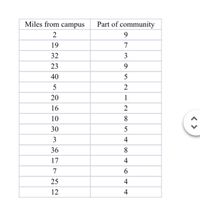
In a study looking at undergraduate students' perceptions of sense of community at their
university, a researcher hypothesizes that the farther away students live from campus (in
miles), the less they feel they are part of the university community. The researcher collected
data for the following two variables - miles from campus and part of community (continuous
rating scale from 1-10 of how much they felt part of the university community).
Analysis Options
T - TEST
1. One sample
2. Independent
3. Dependent
ANOVA
• 1- way
• 2- way
3 - Repeated Measures
Chi-Square
• Chi-Square goodness of fit
• Chi-Square test of independence
Correlation Matrix
Linear Regression
• Simple linear regression
• Multiple linear regression

Transcribed Image Text:Miles from campus
Part of community
2
9.
19
7
32
3
23
9
40
5
2
20
1
16
10
8
30
3
4
36
8.
17
4
7
6.
25
4
12
4
< >
Expert Solution
This question has been solved!
Explore an expertly crafted, step-by-step solution for a thorough understanding of key concepts.
Step by stepSolved in 2 steps

Knowledge Booster
Similar questions
- Find the median, quartiles, minimum, maximum, range, and IQR of the following scores out of 100 on an examarrow_forwardI ask the question again here (in bartleby) , because my teacher said it was wrong (the answer I got from the other bartleby expert). It´s ok!! just please read the instructions and data carefully. (answer the question in the image)arrow_forwardDescribe when you would use an independent samples t-test versus a dependent samplest-test.arrow_forward
- Q6arrow_forwardExplain the meaning of the specified term. Sample dataarrow_forwardPlease provide a correct answer with a full method explanation and do not copy and paste from other similar questions. This question is multiple choice so please give me a correct answer from the given five options.arrow_forward
- Only answer part C, use Part B and the chart if needed.arrow_forwardThe histogram describes the height of students in a math class. Is the data univariate or bivariate? Is the skewness left, right, or normal?arrow_forwardFind Q1, the median, Q3, and the IQR for the data shown below. (Exclude the median from the lower half and from the upper half of the data.) 14 17 18 23 24 48 55 56 68 76 88 Q1 Median= Q3 = IQR = %3Darrow_forward
- Cloud seeding, a process in which chemicals such as silver iodide and frozen carbon dioxide are introduced by aircraft into clouds to promote rainfall was widely used in many years. Recent research has questioned its effectiveness. An experiment as performed by randomly assigning 52 clouds to be seeded or not. The amount of rain generated was then measured in acre-feet. The box plot of the data for the seeded and unseeded clouds are shown in the figure. Which statement best interprets the box plot. Boxplot of Seeded, Unseeded 3000 f 2500어 2000 - 1500 - 1000 - 500- Seeded Unseeded a. Cloud seeding is somewhat effective in promoting rainfall because of the greater mean b. Outliers for both seeded and unseeded data may prove data on the effectiveness of cloud seeding is insufficient c. Extreme outliers are evident in the seeded data and has greater variance O d. There's a greater mean and greater dispersion in the seeded data. Both plots show outliers Dataarrow_forwardWhen manually calculating a Mann-Whitney analysis, the first step is to organize your data in numerical order, from lowest to highest. Which of the following statements is true about this step in the analysis process. Group of answer choices The data should be squared before you sum the data. The data from both groups should be combined before ranking the data. The data should be summed (added) before ranking the data. The data should be ranked with each group independently.arrow_forwardQuestion: You don't have to re-calculate anything. Explain why the mean and median would go up and the mode would stay the same?arrow_forward
arrow_back_ios
SEE MORE QUESTIONS
arrow_forward_ios
Recommended textbooks for you
 MATLAB: An Introduction with ApplicationsStatisticsISBN:9781119256830Author:Amos GilatPublisher:John Wiley & Sons Inc
 Probability and Statistics for Engineering and th...StatisticsISBN:9781305251809Author:Jay L. DevorePublisher:Cengage Learning
 Statistics for The Behavioral Sciences (MindTap C...StatisticsISBN:9781305504912Author:Frederick J Gravetter, Larry B. WallnauPublisher:Cengage Learning
 Elementary Statistics: Picturing the World (7th E...StatisticsISBN:9780134683416Author:Ron Larson, Betsy FarberPublisher:PEARSON
 The Basic Practice of StatisticsStatisticsISBN:9781319042578Author:David S. Moore, William I. Notz, Michael A. FlignerPublisher:W. H. Freeman
 Introduction to the Practice of StatisticsStatisticsISBN:9781319013387Author:David S. Moore, George P. McCabe, Bruce A. CraigPublisher:W. H. Freeman

MATLAB: An Introduction with Applications
Statistics
ISBN:9781119256830
Author:Amos Gilat
Publisher:John Wiley & Sons Inc

Probability and Statistics for Engineering and th...
Statistics
ISBN:9781305251809
Author:Jay L. Devore
Publisher:Cengage Learning

Statistics for The Behavioral Sciences (MindTap C...
Statistics
ISBN:9781305504912
Author:Frederick J Gravetter, Larry B. Wallnau
Publisher:Cengage Learning

Elementary Statistics: Picturing the World (7th E...
Statistics
ISBN:9780134683416
Author:Ron Larson, Betsy Farber
Publisher:PEARSON

The Basic Practice of Statistics
Statistics
ISBN:9781319042578
Author:David S. Moore, William I. Notz, Michael A. Fligner
Publisher:W. H. Freeman

Introduction to the Practice of Statistics
Statistics
ISBN:9781319013387
Author:David S. Moore, George P. McCabe, Bruce A. Craig
Publisher:W. H. Freeman