
ENGR.ECONOMIC ANALYSIS
14th Edition
ISBN: 9780190931919
Author: NEWNAN
Publisher: Oxford University Press
expand_more
expand_more
format_list_bulleted
Related questions
Question
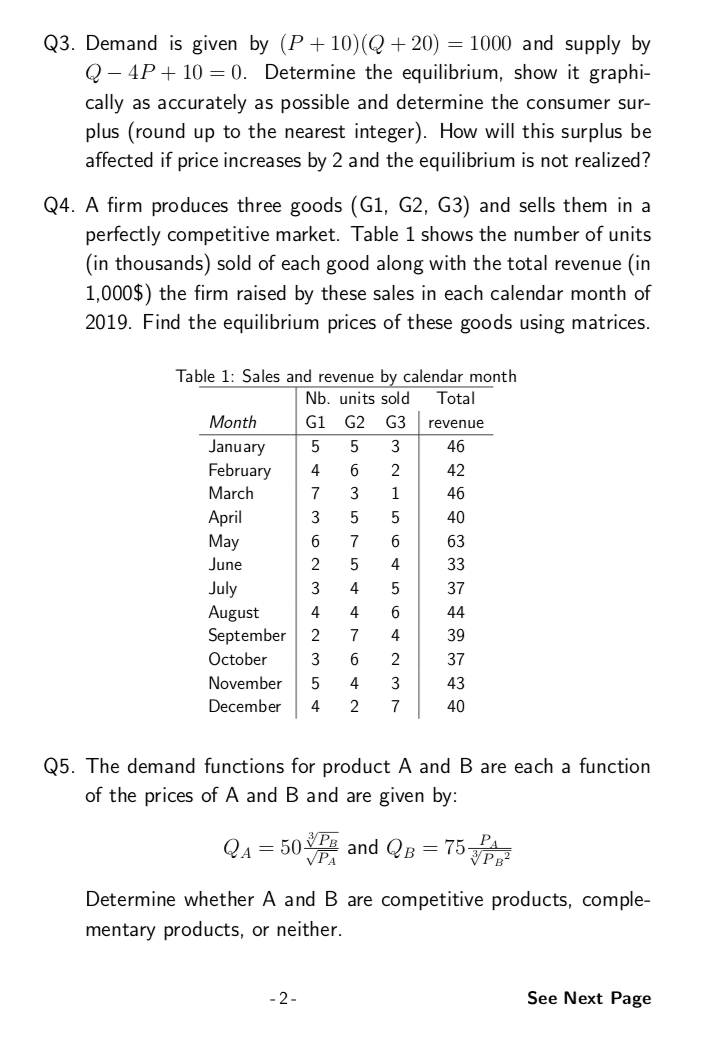

Transcribed Image Text:Q3. Demand is given by (P+ 10)(Q + 20) = 1000 and supply by
Q – 4P+ 10 = 0. Determine the equilibrium, show it graphi-
cally as accurately as possible and determine the consumer sur-
plus (round up to the nearest integer). How will this surplus be
affected if price increases by 2 and the equilibrium is not realized?
Q4. A firm produces three goods (G1, G2, G3) and sells them in a
perfectly competitive market. Table 1 shows the number of units
(in thousands) sold of each good along with the total revenue (in
1,000$) the firm raised by these sales in each calendar month of
2019. Find the equilibrium prices of these goods using matrices.
Table 1: Sales and revenue by calendar month
Nb. units sold
Total
Month
G1 G2 G3
revenue
January
February
March
3
46
6.
2
42
7
3
1
46
April
May
3
40
7
63
June
2
4
33
July
August
September
4
37
4
4
44
2
7
4
39
October
3
2
37
November
4
3
43
December
4
2
7
40
Q5. The demand functions for product A and B are each a function
of the prices of A and B and are given by:
QA = 50 and QB = 75
VPA
Determine whether A and B are competitive products, comple-
mentary products, or neither.
- 2-
See Next Page

Transcribed Image Text:Q1. A sole producer has a marginal revenue function given by:
dTR
= 100 – 3Q?
dQ
Is demand elastic or inelastic if they produce 5 units?
Q2. The Gini coefficient is a number between 0 and 1 and is used
for measuring inequality. A number closer to 1 indicates higher
inequality. Graphically, the Gini coefficient is given by the area
between a diagonal straight line with slope equal to 1 and the
Lorenz curve and this figure divided by the area below the diago-
nal. If The Lorenz curve is given by y = pa²+ px, estimate the
inequality (up to 4 decimals). Compute the Gini coefficient. Is
this an equal or unequal society? Figure 1 represents the diagonal
straight line in red and the Lorenz curve in gray.
Figure 1: Lorenz curve and Gini coefficient
Lorenz Curve
2
4
.6
8
-1-
See Next Page
Expert Solution
This question has been solved!
Explore an expertly crafted, step-by-step solution for a thorough understanding of key concepts.

Step by stepSolved in 2 steps with 2 images

Knowledge Booster


Learn more about
Need a deep-dive on the concept behind this application? Look no further. Learn more about this topic, economics and related others by exploring similar questions and additional content below.Similar questions
- If the marginal revenue is MR=26-Q , find the highest level of production (Q) of the firmwhen its total revenue is 70 dollar.arrow_forwardExplain it early I upvotearrow_forwardThe blue curve on the fallowing graph represents the demand curve facing a firm that can set its own prices. Use the graph input tool to help you answer the folowing questions. You will nor be graded on any changes you make to this graph. Note: Once you enter a value in a white fidd, the graph and any corresponding amounts in each grey field will change accordingly. Graph Input Tool Market for Goods 50 nguantity 25 Semanded (Linita) 40 Demand Price (Dolars per unt) 25.00 Damand 10 10 15 20 a5 0 35 40 QUANTITY (Unts) 45 50 On the graph input tool, change the number found in the Quantity Demanded feld to determine the prices that correspond to the production of 0, 10, 20, 25, 30, 40, and S0 units of output Calculate the total revenue for each of these production leveis. Then, on the fallowing graph, use the green points (triangie symbal) to plot the resuwts. Total Rrvenue S04 445 315 124 10 15 20 25 30 35 40 45 50 CUANTITY (Numbar of unta) TOTAL REVENUE (Dolan) an nd oa)arrow_forward
- Image uploaded solution is not allowed please jiger expert don't upload any imagearrow_forwardWhat is the Marginal Revenue of the function Q=800p^-2arrow_forwardThe demand and supply functions for coal are given as: (In pictures) what is the inverse demand function? what is the inverse supply function?arrow_forward
- Assume a competitive firm faces a market price of $120, and a cost curve of: C = 0.004q° + 25q + 750. Marginal cost (MC) equals MC = 0.012g + 25. (Properly format your expression using the tools in the palette. Hover over tools to see keyboard shortcuts. E.g., a superscript can be created with the ^ character.) If a specific tax of $7 per unit is passed, what would be the new equilibrium output level? It would be units. (Round your answer to two decimal places.) y Reson Etion étv 13 MacBook Air esc F2 %23 & 2 3 4. Q E R Y tab A F G つ caps lock C V shift fn control option command う エarrow_forwardThe production function of a competitive firm is L = q - q2 + q3, where L is the only input of the firm and q is the output. And the input price is 1. Suppose that output price is Rs.1. What will the firm do if levy of Rs 0.5 is imposed on the firm? Suppose a profit tax of 25 percent is imposed on the firm. How much tax will the firm pay if output price is Rs. 1?arrow_forward1 Mario owns a wood-fired pizza shop which imitates traditional Italian methods. She uses a unique sauce that attracts a loyal following of customers. The demand for her pizzas is q = 1650 – 250p, and her costs are TC 0.72+0.0035q. q is the number of pizzas sold per week, TC(q) is Maria's weekly total cost, and p is the price of a pizza. a) What price and output will Maria choose to maximize profits? b) Maria returns to college and asks her cousin Victor to manage her pizza business. Victor faces the same demand and cost conditions as Maria, but he decides to maximize revenue. What price and output should he choose?arrow_forward
- 15. Assume that an entrepreneur's short-run total cost function is C = q³ - 10q² + 17q + 66. Determine the output level at which he maximizes profit if p = 5. Compute the output elasticity of cost at this output.arrow_forwardThe following table shows the relationship between workers and output for a factory in the short run, with capital held constant. This firm is a monopoly in the output market, and price and marginal revenue for the firm are also given in the table. Find the marginal revenue product of labor (MRPL). Marginal Physical Product (MPPL) Labor Input 0 1 2 3 4 5 If the wage rate is $408, this firm will hire 0 20 14 12 9 3 workers. In general, a monopolist will employ Price of Output (P) 40 39 38 37 36 35 Marginal Revenue (MR) 38 36 34 32 30 workers than a similar competitive firm. MRPL 760 504 408 288 90arrow_forwardEach widget firm has the cost structure illustrated in the left graph below. The right graph illustrates two different possible demand curves for widgets, D1 and D2. MC ATC D2 AVC D1 0123456789 10 11 400 1200 1500 2000 2400 2000 Suppose the required assumptions for a perfectly elastic long run supply curve hold for the widget industry. Also, assume that the demand for widgets is depicted by the demand curve D1, and that the industry is in long-run equilibrium. What is the long- run output (quantity produced) for the entire industry? O 1600 1200 2000 O 800 O 400 Previousarrow_forward
arrow_back_ios
SEE MORE QUESTIONS
arrow_forward_ios
Recommended textbooks for you
 Principles of Economics (12th Edition)EconomicsISBN:9780134078779Author:Karl E. Case, Ray C. Fair, Sharon E. OsterPublisher:PEARSON
 Engineering Economy (17th Edition)EconomicsISBN:9780134870069Author:William G. Sullivan, Elin M. Wicks, C. Patrick KoellingPublisher:PEARSON
 Principles of Economics (MindTap Course List)EconomicsISBN:9781305585126Author:N. Gregory MankiwPublisher:Cengage Learning
 Managerial Economics: A Problem Solving ApproachEconomicsISBN:9781337106665Author:Luke M. Froeb, Brian T. McCann, Michael R. Ward, Mike ShorPublisher:Cengage Learning
 Managerial Economics & Business Strategy (Mcgraw-...EconomicsISBN:9781259290619Author:Michael Baye, Jeff PrincePublisher:McGraw-Hill Education
Principles of Economics (12th Edition)
Economics
ISBN:9780134078779
Author:Karl E. Case, Ray C. Fair, Sharon E. Oster
Publisher:PEARSON
Engineering Economy (17th Edition)
Economics
ISBN:9780134870069
Author:William G. Sullivan, Elin M. Wicks, C. Patrick Koelling
Publisher:PEARSON
Principles of Economics (MindTap Course List)
Economics
ISBN:9781305585126
Author:N. Gregory Mankiw
Publisher:Cengage Learning
Managerial Economics: A Problem Solving Approach
Economics
ISBN:9781337106665
Author:Luke M. Froeb, Brian T. McCann, Michael R. Ward, Mike Shor
Publisher:Cengage Learning
Managerial Economics & Business Strategy (Mcgraw-...
Economics
ISBN:9781259290619
Author:Michael Baye, Jeff Prince
Publisher:McGraw-Hill Education