
MATLAB: An Introduction with Applications
6th Edition
ISBN: 9781119256830
Author: Amos Gilat
Publisher: John Wiley & Sons Inc
expand_more
expand_more
format_list_bulleted
Related questions
Question
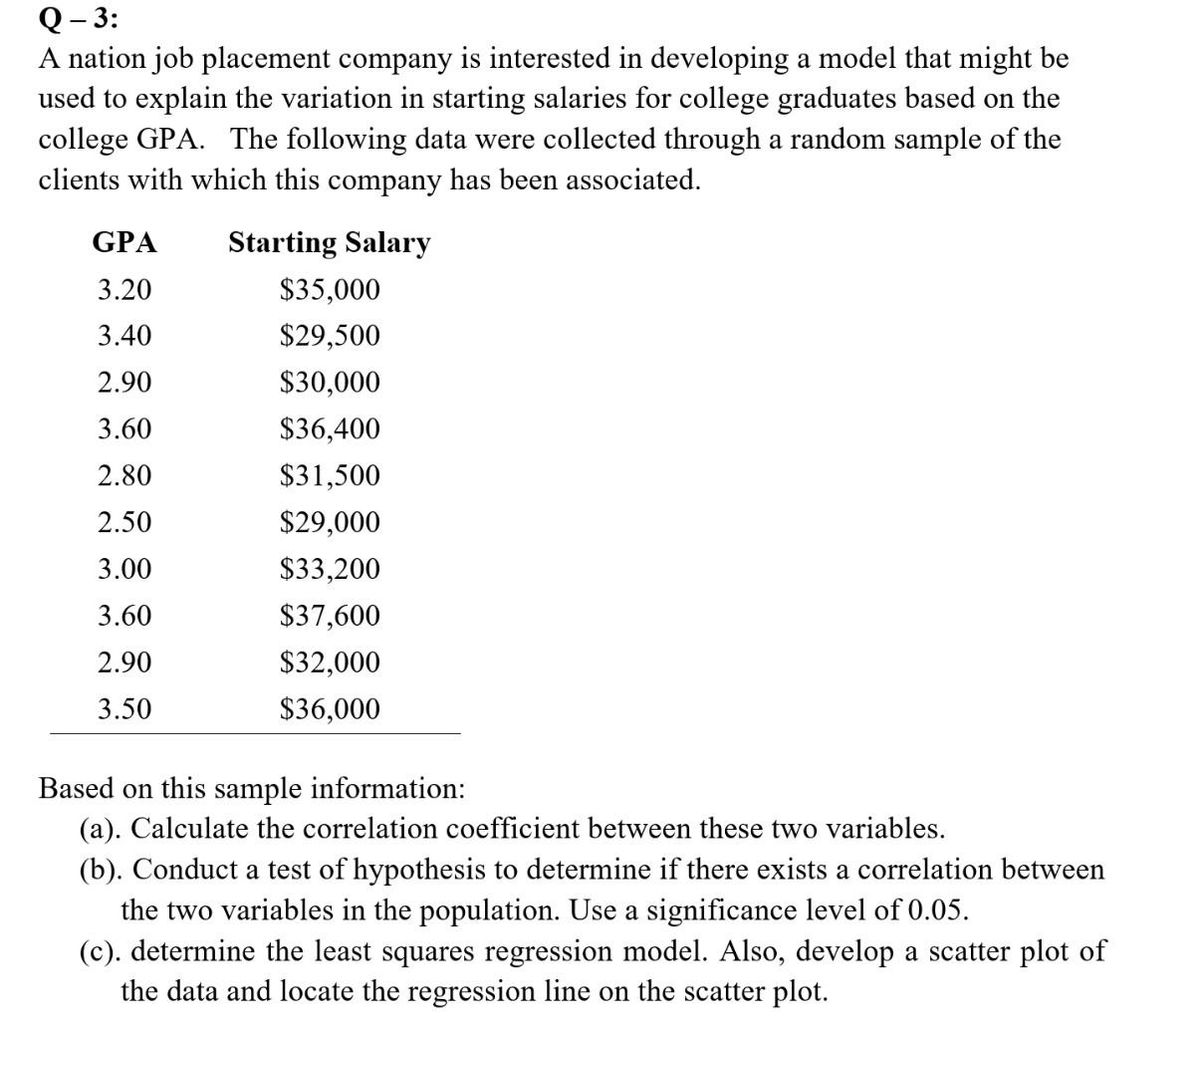

Transcribed Image Text:Q-3:
A nation job placement company is interested in developing a model that might be
used to explain the variation in starting salaries for college graduates based on the
college GPA. The following data were collected through a random sample of the
clients with which this company has been associated.
Starting Salary
GPA
3.20
3.40
2.90
3.60
2.80
2.50
3.00
3.60
2.90
3.50
$35,000
$29,500
$30,000
$36,400
$31,500
$29,000
$33,200
$37,600
$32,000
$36,000
Based on this sample information:
(a). Calculate the correlation coefficient between these two variables.
(b). Conduct test of hypothesis to determine if there exists a correlation between
the two variables in the population. Use a significance level of 0.05.
(c). determine the least squares regression model. Also, develop a scatter plot of
the data and locate the regression line on the scatter plot.
Expert Solution
This question has been solved!
Explore an expertly crafted, step-by-step solution for a thorough understanding of key concepts.

Step by stepSolved in 2 steps with 4 images

Knowledge Booster

Similar questions
- The owner of Maumee Ford-Volvo wants to study the relationship between the age of a car and its selling price. Listed below is a random sample of 12 used cars sold at the dealership during the last year. Car Age (years) Selling Price ($000) 1 11 12.1 2 8 10.5 3 14 5.7 4 17 4.9 5 9 5.0 6 8 13.4 7 10 10.5 8 14 9.0 9 13 9.0 10 17 4.5 11 6 12.5 12 6 11.5 Click here for the Excel Data Filea. Determine the regression equation. (Negative amounts should be indicated by a minus sign. Round your answers to 3 decimal places.) a= b= Estimate the selling price of an 7-year-old car (in $000). (Round your answer to 3 decimal places.) Interpret the regression equation (in dollars). (Round your answer to the nearest dollar amount.)arrow_forwardThe price of a share of stock divided by the company's estimated future earnings per share is called the P/E ratio. High P/E ratios usually indicate "growth" stocks, or maybe stocks that are simply overpriced. Low P/E ratios indicate "value" stocks or bargain stocks. A random sample of 51 of the largest companies in the United States gave the following P/E ratiost. 9 20 11 35 19 13 15 21 29 53 16 26 21 14 21 27 10 12 47 14 40 18 60 72 33 14 8 49 5 16 8 19 12 31 67 51 26 18 17 20 19 13 25 23 27 44 20 27 19 18 32 (a) Use a calculator with mean and sample standard deviation keys to find the sample mean x and sample standard deviation s. (Round your answers to one decimal place.) (b) Find a 90% confidence interval for the P/E population mean u of all large U.S. companies. (Round your answers to one decimal place.) lower limit upper limit (c) Find a 99% confidence interval for the P/E population mean u of all large U.S. companies. (Round your answers to one decimal place.) lower limit upper…arrow_forwardWhen an audit must be conducted that involves a tedious examination of a large inventory, the audit may be very costly and time consuming if each item in the inventory must be examined. In such situations, the auditor frequently obtains a random sample of items from the complete inventory and uses the results of an audit of the sampled items to check the validity of the company's financial statement. A large company’s financial statement claims an inventory that averages $600 per item. The following data are the auditor’s assessment of a random sample of 75 items from the company’s inventory. The values resulting from the audit are rounded to the nearest dollar. Estimate the mean value of an item in the inventory using a 95% confidence interval. Is there substantial evidence (a 5 .01) that the mean value of an item in the inventory is less than $600? What is the target population for the above inferences? Would normal distribution–based procedures be appropriate for answering the…arrow_forward
- #2...Can you write out answer please n thank uarrow_forwardA professor was interested in how exam performance related to study time. Just before an exam began the professor asked students in his class to write down how many hours they had studied for the exam in the past two weeks. He then compared their exam scores to the reported study time. What type of study did the professor carry out? ex post facto correlational case experimentalarrow_forwardA statistical program is recommended. Jensen Tire & Auto is in the process of deciding whether to purchase a maintenance contract for its new computer wheel alignment and balancing machine. Managers feel that maintenance expense should be related to usage, and they collected the following information on weekly usage (hours) and annual maintenance expense (in hundreds of dollars). Weekly Usage (hours) Annual Maintenance Expense 13 17.0 10 22.0 20 30.0 28 37.0 32 47.0 17 30.5 24 32.5 31 39.0 40 51.5 38 40.0 (a) Develop the estimated regression equation that could be used to predict the annual maintenance expense (in hundreds of dollars) given the weekly usage (in hours). (Round your numerical values to two decimal places.)arrow_forward
- (3) The table contains hypothetical data from a study that a bank conducted on the credit card balances of male and female credit card holders (credit cards owned by both men and women were left out of the study). Male Female Mean $3,550 $2,670 Median $2,175 $2,500 Std Dev $1,240 $825 a. What conclusions can we come to by comparing the medians of the males and females? b. What conclusions can we come to by comparing the standard deviations of the males and females? c. Notice that the mean and median of the males are fairly far apart while the mean and median of the females are not. What does this tell us about the credit card balances of the males vs the credit card balances of the females?arrow_forward10arrow_forwardA hospital has a main campus and three satellite locations. Management wants to reduce waiting time for ER cases. A random sample of 11 ER cases at each location was selected, and the waiting time was measured. (The table of data at the very end may be copied and pasted directly into Excel.) Complete parts (a) through (d) to determine if there is statistical evidence of a difference in the mean waiting times betweeen the four locations. Part 1 a. State the two hypotheses. Choose the correct answer below. A.H0:μ1=μ2=•••=μ4H1:Not allμjare equal (where j=1,2,...,4) B.H0:μ1=μ2=•••=μ4H1:μ1≠μ2≠•••≠μ4 C.H0:μ1=μ2=•••=μ11H1:μ1≠μ2≠•••≠μ11 D.H0:μ1=μ2=•••=μ11H1:Not allμjare equal (wherej=1,2,...,11) b. At the 0.05 level of significance, state the test statistic. (Round to two decimal places to the right of the decimal point as needed.) A.FSTAT = 0.005, from the first row of the ANOVA table B.FSTAT = 4.91, from the first row of the ANOVA table…arrow_forward
arrow_back_ios
arrow_forward_ios
Recommended textbooks for you
- MATLAB: An Introduction with ApplicationsStatisticsISBN:9781119256830Author:Amos GilatPublisher:John Wiley & Sons Inc
 Probability and Statistics for Engineering and th...StatisticsISBN:9781305251809Author:Jay L. DevorePublisher:Cengage Learning
 Statistics for The Behavioral Sciences (MindTap C...StatisticsISBN:9781305504912Author:Frederick J Gravetter, Larry B. WallnauPublisher:Cengage Learning
  Elementary Statistics: Picturing the World (7th E...StatisticsISBN:9780134683416Author:Ron Larson, Betsy FarberPublisher:PEARSON
 The Basic Practice of StatisticsStatisticsISBN:9781319042578Author:David S. Moore, William I. Notz, Michael A. FlignerPublisher:W. H. Freeman
 Introduction to the Practice of StatisticsStatisticsISBN:9781319013387Author:David S. Moore, George P. McCabe, Bruce A. CraigPublisher:W. H. Freeman
MATLAB: An Introduction with Applications
Statistics
ISBN:9781119256830
Author:Amos Gilat
Publisher:John Wiley & Sons Inc
Probability and Statistics for Engineering and th...
Statistics
ISBN:9781305251809
Author:Jay L. Devore
Publisher:Cengage Learning
Statistics for The Behavioral Sciences (MindTap C...
Statistics
ISBN:9781305504912
Author:Frederick J Gravetter, Larry B. Wallnau
Publisher:Cengage Learning
Elementary Statistics: Picturing the World (7th E...
Statistics
ISBN:9780134683416
Author:Ron Larson, Betsy Farber
Publisher:PEARSON
The Basic Practice of Statistics
Statistics
ISBN:9781319042578
Author:David S. Moore, William I. Notz, Michael A. Fligner
Publisher:W. H. Freeman
Introduction to the Practice of Statistics
Statistics
ISBN:9781319013387
Author:David S. Moore, George P. McCabe, Bruce A. Craig
Publisher:W. H. Freeman