#2...Can you write out answer please n thank u

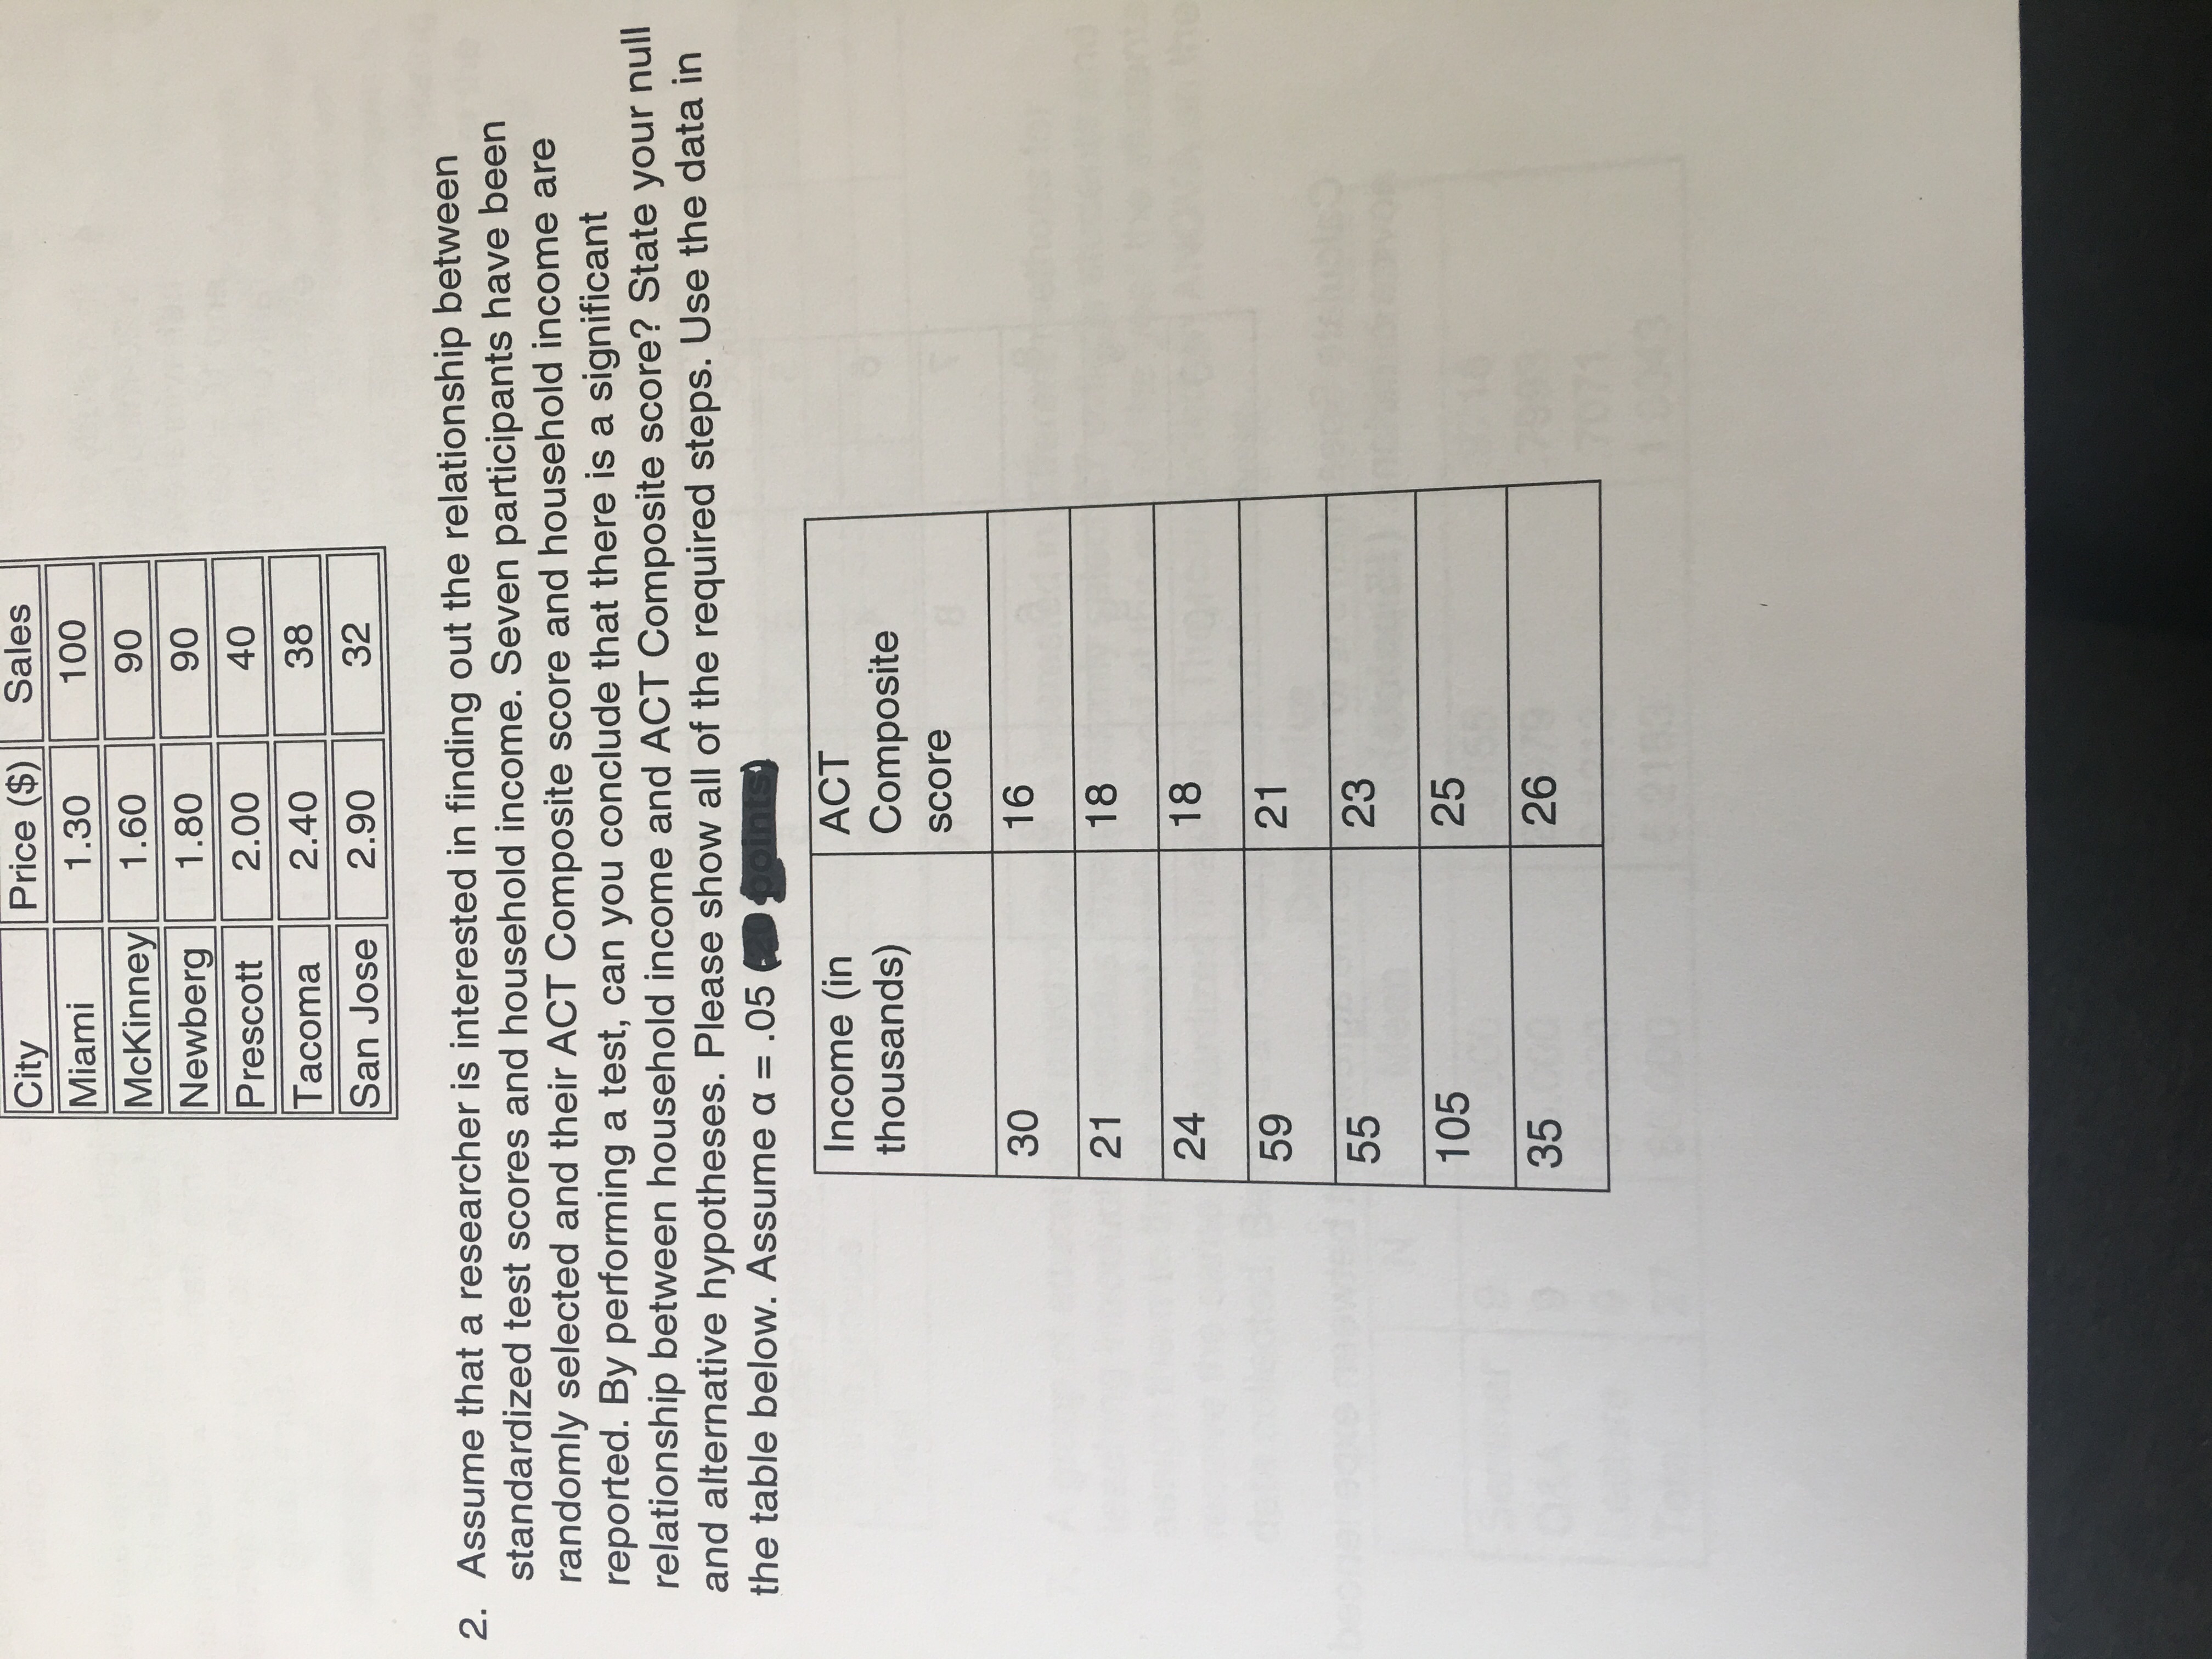
Let r denote the linear correlation between income (x) and ACT composite score (y). The hypotheses are given below:
Null hypothesis:
H0: r = 0
That is, the sample correlation coefficient (r) is not significantly different from zero. There is no significant positive linear relationship between income and ACT composite score.
Alternative hypothesis:
Ha: r ≠ 0
That is, the sample correlation coefficient is significantly different from zero.
There is a significant positive linear relationship between income and ACT composite score.
Degrees of freedom:
The formula for degrees of freedom is as follows:
Df = n – 2.
The number of data values given are 7, that is n = 7.
Substitute n = 7 in the degrees of freedom formula.
Df = n – 2 = 10 – 2 = 8.
The level of significance for the test is 0.05.
Sample correlation coefficient:
The value of the sample correlation coefficient (r) can be obtained using Excel formula.
Enter the values of income in columns A2:A8 in Excel.
Enter the values of ACT composite score in columns B2:B8 in Excel.
Enter the function, =CORREL(A2:A8,B2:B8).
Thus, the value of the sample correlation coefficient, r is 0.6203.
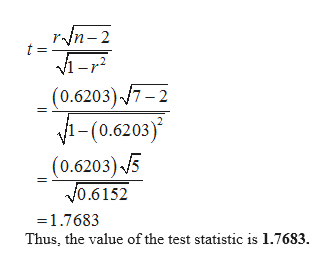
Test Statistic:
The test statistic for hypothesis test is calculated as follows:

Trending nowThis is a popular solution!
Step by stepSolved in 2 steps with 1 images

- ?? this is not true and incompletearrow_forwardO A bike trail 13 miles long connects a coffee shop to a bike shop. There is a water fountain 5 miles from the coffee shop and 12 miles from the bike shop. Which of the following diagrams represents the relationship between the coffee shop, C, the bike shop, B, and the water fountain, W? O Submit Answer 14 W B W C O 44 DELL Oll ✓ INTLarrow_forwardSimplify. 12,11 20s t Assume that all yariables represent positive real numbers.arrow_forward
 MATLAB: An Introduction with ApplicationsStatisticsISBN:9781119256830Author:Amos GilatPublisher:John Wiley & Sons Inc
 Probability and Statistics for Engineering and th...StatisticsISBN:9781305251809Author:Jay L. DevorePublisher:Cengage Learning
 Statistics for The Behavioral Sciences (MindTap C...StatisticsISBN:9781305504912Author:Frederick J Gravetter, Larry B. WallnauPublisher:Cengage Learning
 Elementary Statistics: Picturing the World (7th E...StatisticsISBN:9780134683416Author:Ron Larson, Betsy FarberPublisher:PEARSON
 The Basic Practice of StatisticsStatisticsISBN:9781319042578Author:David S. Moore, William I. Notz, Michael A. FlignerPublisher:W. H. Freeman
 Introduction to the Practice of StatisticsStatisticsISBN:9781319013387Author:David S. Moore, George P. McCabe, Bruce A. CraigPublisher:W. H. Freeman


