ENGR.ECONOMIC ANALYSIS
14th Edition
ISBN: 9780190931919
Author: NEWNAN
Publisher: Oxford University Press
expand_more
expand_more
format_list_bulleted
Question
1. Consider the Kenyan market for lemons.
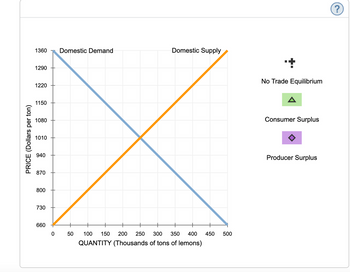
The following graph shows the domestic demand and domestic supply curves for lemons in Kenya. Suppose Kenya's government currently does not allow the international trade in lemons.
Use the black point (plus symbol) to indicate the equilibrium price of a ton of lemons and the equilibrium quantity of lemons in Kenya in the absence of international trade. Then, use the green point (triangle symbol) to shade the area representing consumer surplus in equilibrium. Finally, use the purple point (diamond symbol) to shade the area representing producer surplus in equilibrium.
Note: Select and drag a fill area point from the palette to the graph. To fill in regions on the graph, merely drop the fill area point on the desired region.
Based on the previous graph, total surplus in the absence of international trade is_________.
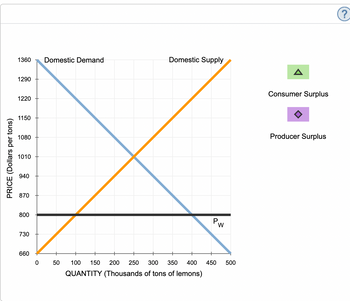
2. The following graph shows the same domestic demand and supply curves for lemons in Kenya. Suppose that the Kenyan government changes its international trade policy to allow the free trade of lemons. The horizontal black line (PWPW) represents the world price of lemons at $800 per ton. Assume that Kenya's entry into the world market for lemons has no effect on the world price and there are no transportation or transaction costs associated with international trade in lemons. Also assume that domestic suppliers will satisfy domestic demand as much as possible before any exporting or importing takes place.
Use the green point (triangle symbol) to shade consumer surplus, and then use the purple point (diamond symbol) to shade producer surplus.
3. When Kenya allows free trade of lemons, the price of a ton of lemons in Kenya will be $800. At this price _____ tons of lemons will be demanded in Kenya, and_____ tons will be supplied by domestic suppliers. Therefore, Kenya will import_____ tons of lemons.
4. Using the information from the previous tasks, complete the following table to analyze the welfare effect of allowing free trade.
Without Free Trade(Millions of dollars) With Free Trade(Millions of dollars)
Consumer Surplus ____________ ___________Producer Surplus ______________ ___________
When Kenya allows free trade, the country's consumer surplus ______ by______ and producer surplus ______ by ______. So, the net effect of international trade on Kenya's total surplus is a _______ of _______.

Transcribed Image Text:PRICE (Dollars per ton)
1360
Domestic Demand
Domestic Supply
1290
1220
1150
1080
1010
940
870
800
730
660
0
50
100 150 200 250 300
350
400 450 500
QUANTITY (Thousands of tons of lemons)
+
No Trade Equilibrium
Consumer Surplus
Producer Surplus
?

Transcribed Image Text:PRICE (Dollars per tons)
1360
Domestic Demand
Domestic Supply
1290
1220
1150
1080
1010
940
870
800
730
W
660
0
50
100 150 200 250 300 350 400 450 500
QUANTITY (Thousands of tons of lemons)
A
Consumer Surplus
Producer Surplus
?
Expert Solution
This question has been solved!
Explore an expertly crafted, step-by-step solution for a thorough understanding of key concepts.
This is a popular solution
Trending nowThis is a popular solution!
Step by stepSolved in 2 steps with 5 images

Knowledge Booster
Similar questions
- The following diagram shows supply and demand in the market for tablets. Use the black point (plus symbol) to indicate the equilibrium price and quantity of tablets. Then use the green point (triangle symbol) to fill the area representing consumer surplus, and use the purple point (diamond symbol) to fill the area representing producer surplus. PRICE (Dollars per tablet) 150 135 120 105 90 45 30 15 0 0 Demand Supply + 35 70 105 140 175 210 245 280 QUANTITY (Millions of tablets) Total surplus in this market is $ 315 350 million. Equilibrium Consumer Surplus Producer Surplusarrow_forward22. < Previou Suppose there are three countries in the world: Volcania, Portlandia, and Minitown. These three countries produce a total of 3 different kinds of goods: Raspberries, Pomegranates, and Guavas. If Volcania imposes a tariff on Raspberries from Portlandia, and Minitown. OThe price of Raspberries in Volcania will increase for everyone OThe Raspberries industry in Minitown will benefit OThe Raspberries in Portlandia will be the only one to see higher prices for this productarrow_forward1. Given below are two groups’ (consumers, c, and a special interest group, i) true demands concerning a tariff on snack foods. Demand against (consumers): wtp($) = 80 + 2t Demand for (special interest): wtp($) = 50 - t Where t is the tariff rate. a. Graph the demand curves and explain how much tariff there will be if there were no free riding and all preferences were fully revealed. b. Now assume that “free riding” plagues the consumer group so that their revealed willingness to pay is given by: wtp($) = 30 + t . What are some causes of the “free riding”? Why is this not likely to happen to the producer group? c. Now what will be the equilibrium tariff rate? Graph this scenario in the same graph. d. Relate the outcome to a partial equilibrium tariff graph.arrow_forward
- 27. Suppose IP is the international trade price and this country's government imposes a $3 tariff on imports of this good, what will be the loss to consumers? 28. Suppose IP is the international trade price and this country's government imposes a $3 tariff on imports of this good, what will be the net loss to this econom? 29. Suppose IP is the international trade price and this country's government imposes a $3 tariff on imports of this good, how much revenue will the government collect? 30. Suppose IP is the international trade price and this country's government imposes a 6 unit quota on imports of this good, what will be the net loss to this econom?arrow_forwardThis figure shows demand and supply for a product in country A, which is interested in engaging in international trade. The import price from country B is $3 and from country C is $4. Country A imposes a fixed tariff of $2 per unit of import. Answer the following questions based on these assumptions. Demand Supply O creation will be FJ O diversion will be FJ O creation will be TS O diversion will be TS Querits Based on information provided in the figure above, if country A decides to enter into a free trade agreement with country B, the amount of tradearrow_forwardRussia trades chocolate with France, where it is a staple. The government of Russia places a price floor on their market for chocolate (assume that it is binding). They buy the surplus of 4 units from the producers and sell it in France. Refer to the graph to determine what happens when the government then sells the excess on the world market (to France). What should the government of Russia charge in order to sell four units of chocolate in France? Round your answer to the nearest whole number. $ Price $10 9 8 7 6 5 4 3 2 1 Market for chocolate in France 0 1 2 3 4 5 6 7 Supply Demand 8 9 Quantity 10arrow_forward
- Below is a domestic supply and demand graph for cotton. Label the free trade equilibrium point (FTE). Assume a tariff is placed on imported cotton that eliminates all imports. 1. Label the tariff equilibrium point (TE). 2. Shade in the lost gains from trade (LGT) because of this tariff. Lost gains from trade are also called deadweight loss. 3. Shade in the area representing the wasted resources (WR) created as a result of the restriction on imported cotton. Price per pound (cents) 120 115 110 105 100 95 90 85 80 75 domestic demand amount of cotton: VE 22 domestic supply 70 0 2 4 6 8 10 12 14 16 18 20 22 24 26 28 30 32 34 36 38 40 Quantity (billion lbs) Incorrect TE world supply At the free trade equilibrium point, how much cotton does the United States grow and produce? LGT WR billion lbsarrow_forward15arrow_forwardSuppose Guatemala is open to free trade in the world market for wheat. Since Guatemala is small relative to the international market, the demand for and supply of wheat in Guatemala have no impact on the world price. The following graph shows the domestic market for wheat in Guatemala. The world price of a ton of wheat is Pw = $400. On the following graph, use the green triangle (triangle symbols) to shade the area representing consumer surplus (CS) when the economy is at the free-trade equilibrium. Then, use the purple triangle (diamond symbols) to shade the area representing producer surplus (PS). (?) PRICE (Dollars per ton) 1200 1100 1000+ 900 800 700 600 500 400 300- 200 0 Domestic Demand 20 40 Domestic Supply 60 80 100 120 140 QUANTITY (Tons of wheat) PW 160 180 200 A CS T PS Because Guatemala participates in international trade in the market for wheat, it will import tons of wheat. Now suppose the Guatemalan government decides to impose a tariff of $200 on each imported ton of…arrow_forward
- Give explanation also pleasearrow_forwardBased on the following table, what is the no-trade equilibrium quantity supplied and demanded for Country 2? Enter your answer in the box below. Price 10 12 14 16 18 20 22 24 Country 1: Quantity Supplied 5 6 7 8 9 10 11 12 Type your answer... Country 1: Quantity Demanded 20 18 16 14 12 10 8 6 Country 2: Quantity Supplied 10 11 12 13 14 15 16 17 Country 2: Quantity Demanded 10 9 8 7 6 5 4 3arrow_forwardThe U.S. is an importer of ethanol, and let’s assume they are a price-taker in the world market. Suppose that a technological advance in ethanol production in Brazil, the world’s largest exporter, drives down the world price of ethanol by $5. Draw a graph and explain how this change in world price affects consumer surplus, producer surplus, and total surplus in the U.S. market. Now suppose the U.S. government institutes an import tariff of $5 in response to the fall in the world price. On your graph label the revenue raised by the tariff and the deadweight loss created (if it exists). Who is likely to support this policy? Suppose that the fall in price is attributable not to a technological advance but to a subsidy from the Brazilian government to Brazilian ethanol producers. How would this affect your analysis?arrow_forward
arrow_back_ios
SEE MORE QUESTIONS
arrow_forward_ios
Recommended textbooks for you

 Principles of Economics (12th Edition)EconomicsISBN:9780134078779Author:Karl E. Case, Ray C. Fair, Sharon E. OsterPublisher:PEARSON
 Engineering Economy (17th Edition)EconomicsISBN:9780134870069Author:William G. Sullivan, Elin M. Wicks, C. Patrick KoellingPublisher:PEARSON
 Principles of Economics (MindTap Course List)EconomicsISBN:9781305585126Author:N. Gregory MankiwPublisher:Cengage Learning
 Managerial Economics: A Problem Solving ApproachEconomicsISBN:9781337106665Author:Luke M. Froeb, Brian T. McCann, Michael R. Ward, Mike ShorPublisher:Cengage Learning
 Managerial Economics & Business Strategy (Mcgraw-...EconomicsISBN:9781259290619Author:Michael Baye, Jeff PrincePublisher:McGraw-Hill Education


Principles of Economics (12th Edition)
Economics
ISBN:9780134078779
Author:Karl E. Case, Ray C. Fair, Sharon E. Oster
Publisher:PEARSON

Engineering Economy (17th Edition)
Economics
ISBN:9780134870069
Author:William G. Sullivan, Elin M. Wicks, C. Patrick Koelling
Publisher:PEARSON

Principles of Economics (MindTap Course List)
Economics
ISBN:9781305585126
Author:N. Gregory Mankiw
Publisher:Cengage Learning

Managerial Economics: A Problem Solving Approach
Economics
ISBN:9781337106665
Author:Luke M. Froeb, Brian T. McCann, Michael R. Ward, Mike Shor
Publisher:Cengage Learning

Managerial Economics & Business Strategy (Mcgraw-...
Economics
ISBN:9781259290619
Author:Michael Baye, Jeff Prince
Publisher:McGraw-Hill Education