Computer Networking: A Top-Down Approach (7th Edition)
7th Edition
ISBN: 9780133594140
Author: James Kurose, Keith Ross
Publisher: PEARSON
expand_more
expand_more
format_list_bulleted
Question
thumb_up100%
7act2 Please help me answer this in python

Transcribed Image Text:1 Exam Grades
2
69
3
99
4
73
8
10
57
11
58
12
67
13
88
14
72
15
69
16
17
18
19
90
20
63
21
66
92
54
61
59
26
48
27
71
28
83
29
89
30
100
66
39
41
99
37
68
38
52
39
78
40
77
41
73
42
40
43
46
96
47
44
48
54
49
50
89
51
72

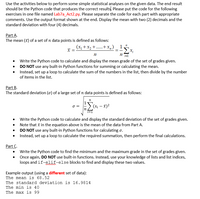
Transcribed Image Text:Use the activities below to perform some simple statistical analyses on the given data. The end result
should be the Python code that produces the correct results, Please put the code for the following
exercises in one file named Lab7a_Act2.py. Please separate the code for each part with appropriate
comments. Use the output format shown at the end. Display the mean with two (2) decimals and the
standard deviation with four (4) decimals.
Part A.
The mean (x) of a set of n data points is defined as follows:
(x, + x2 +.....+x,,) - !5x,
x =
i=1
• Write the Python code to calculate and display the mean grade of the set of grades given.
• DO NOT use any built-in Python functions for summing or calculating the mean.
• Instead, set up a loop to calculate the sum of the numbers in the list, then divide by the number
of items in the list.
Part B.
The standard deviation (o) of a large set of n data points is defined as follows:
(X; – x)2
O =
• Write the Python code to calculate and display the standard deviation of the set of grades given.
Note that i in the equation above is the mean of the data from Part A.
• DO NOT use any built-in Python functions for calculating o.
Instead, set up a loop to calculate the required summation, then perform the final calculations.
Part C.
Write the Python code to find the minimum and the maximum grade in the set of grades given.
Once again, DO NOT use built-in functions. Instead, use your knowledge of lists and list indices,
loops and if-elif-else blocks to find and display these two values.
Example output (using a different set of data):
The mean is 68.52
The standard deviation is 16.9814
The min is 40
The max is 99
Expert Solution
This question has been solved!
Explore an expertly crafted, step-by-step solution for a thorough understanding of key concepts.
Step by stepSolved in 2 steps with 3 images

Knowledge Booster
Similar questions
- I am having trouble with this homework question for my intro c++ course. 1. Explain the concept of a contiguous block of memory. 2. Explain how the compiler uses an index to locate a value in an array.arrow_forwardProvide your own short C++ code example that uses arrays. Be sure to test and explain your code.arrow_forwardCan you think of any parallels between a pointer and a reference?arrow_forward
- Using points, describe the design issues. The majority of computer language pointers can only point to a single kind of variable.arrow_forwardUsing the Python language answer the following questions below. Please tell me what program you use if it is IDLE or Atom or a python website please provide the website you use.arrow_forwardIn Between Code in C languagearrow_forward
- Define Constant Arrays as Formal Parameters.arrow_forwardMust be in C# and this assignment only Rare Collection. We can make arrays of custom objects just like we’vedone with ints and strings. While it’s possible to make both 1D and 2D arrays of objects(and more), for this assignment we’ll start you out with just one dimensional arrays.Your parents have asked you to develop a program to help them organize the collectionof rare CDs they currently have sitting in their car’s glove box. To do this, you will firstcreate an AudioCD class. It should have the following private attributes. String cdTitle String[4] artists int releaseYear String genre float conditionYour class should also have the following methods: Default Constructor: Initializes the five attributes to the following default values:◦ cdTitle = “”◦ artists = {“”, “”, “”, “”}◦ releaseYear = 1980◦ genre = “”◦ condition = 0.0 Overloaded Constructor: Initializes the five attributes based on values passedinto the formal parameters◦ If condition is less than 0.0 or greater than 5.0,…arrow_forward
arrow_back_ios
arrow_forward_ios
Recommended textbooks for you
 Computer Networking: A Top-Down Approach (7th Edi...Computer EngineeringISBN:9780133594140Author:James Kurose, Keith RossPublisher:PEARSON
 Computer Organization and Design MIPS Edition, Fi...Computer EngineeringISBN:9780124077263Author:David A. Patterson, John L. HennessyPublisher:Elsevier Science
 Network+ Guide to Networks (MindTap Course List)Computer EngineeringISBN:9781337569330Author:Jill West, Tamara Dean, Jean AndrewsPublisher:Cengage Learning
 Concepts of Database ManagementComputer EngineeringISBN:9781337093422Author:Joy L. Starks, Philip J. Pratt, Mary Z. LastPublisher:Cengage Learning
 Prelude to ProgrammingComputer EngineeringISBN:9780133750423Author:VENIT, StewartPublisher:Pearson Education
 Sc Business Data Communications and Networking, T...Computer EngineeringISBN:9781119368830Author:FITZGERALDPublisher:WILEY

Computer Networking: A Top-Down Approach (7th Edi...
Computer Engineering
ISBN:9780133594140
Author:James Kurose, Keith Ross
Publisher:PEARSON

Computer Organization and Design MIPS Edition, Fi...
Computer Engineering
ISBN:9780124077263
Author:David A. Patterson, John L. Hennessy
Publisher:Elsevier Science

Network+ Guide to Networks (MindTap Course List)
Computer Engineering
ISBN:9781337569330
Author:Jill West, Tamara Dean, Jean Andrews
Publisher:Cengage Learning

Concepts of Database Management
Computer Engineering
ISBN:9781337093422
Author:Joy L. Starks, Philip J. Pratt, Mary Z. Last
Publisher:Cengage Learning

Prelude to Programming
Computer Engineering
ISBN:9780133750423
Author:VENIT, Stewart
Publisher:Pearson Education

Sc Business Data Communications and Networking, T...
Computer Engineering
ISBN:9781119368830
Author:FITZGERALD
Publisher:WILEY