
A First Course in Probability (10th Edition)
10th Edition
ISBN: 9780134753119
Author: Sheldon Ross
Publisher: PEARSON
expand_more
expand_more
format_list_bulleted
Related questions
Concept explainers
Topic Video
Question
thumb_up100%
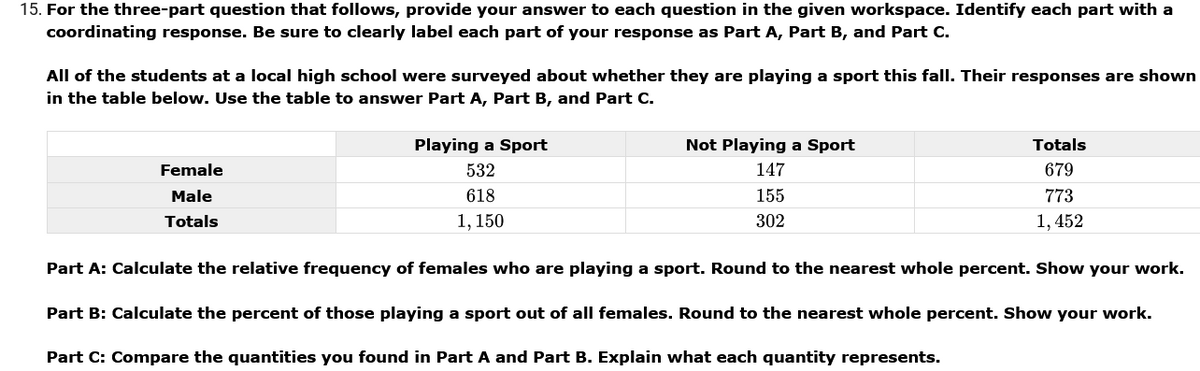

Transcribed Image Text:15. For the three-part question that follows, provide your answer to each question in the given workspace. Identify each part with a
coordinating response. Be sure to clearly label each part of your response as Part A, Part B, and Part C.
All of the students at a local high school were surveyed about whether they are playing a sport this fall. Their responses are shown
in the table below. Use the table to answer Part A, Part B, and Part C.
Playing a Sport
Not Playing a Sport
Totals
Female
532
147
679
Male
618
155
773
Totals
1, 150
302
1, 452
Part A: Calculate the relative frequency of females who are playing a sport. Round to the nearest whole percent. Show your work.
Part B: Calculate the percent of those playing a sport out of all females. Round to the nearest whole percent. Show your work.
Part C: Compare the quantities you found in Part A and Part B. Explain what each quantity represents.
Expert Solution
This question has been solved!
Explore an expertly crafted, step-by-step solution for a thorough understanding of key concepts.

This is a popular solution

Trending nowThis is a popular solution!

Step by stepSolved in 3 steps

Knowledge Booster


Learn more about
Need a deep-dive on the concept behind this application? Look no further. Learn more about this topic, probability and related others by exploring similar questions and additional content below.Similar questions
- z = -1 is what percentile? percentileState your answer to the nearest tenth of a percent. Submit QuestionQuestion 5arrow_forwardSubject : Basic Statistics 6. I've posted an image of the question. Thank you.arrow_forward44. Fireworks Revenue. Revenue from display fireworks in the United States increased from $141 million in 1998 to $320 million in 2012 (Source: American Pyrotechnics Association). Find the average rate of change in the revenue from fireworks in the United States from 1998 to 2012.arrow_forward
- K Disk drives have been getting larger. Their capacity is now often given in terabytes (TB) where 1 TB = 1000 gigabytes, or about a trillion bytes. A survey of prices for external disk drives found the data shown to the right. For this data, we want to predict Price from Capacity. Complete parts a through i below. Click the icon to view the disk drive data and summary statistics. Disk Drive Data and Summary Statistics Capacity (in TB) 0.5 1.0 2.0 3.0 4.0 6.0 8.0 12.0 32.0 x = 7.611 SD(x) = 9.85 r = 0.987 --- Print Price (in $) 58.79 75.79 114.00 105.95 146.45 425.49 594.00 1074.00 4464.49 y = 784.329 SD(y) = 1420.27 Done X A. It indicates the price for a hard drive with no capacity. It is meaningless and should not be interpreted. B. It indicates the additional capacity in TB for each additional dollar of price. It is meaningful in that it could be interpreted as the cost of the parts common to all drives.arrow_forwardyour car is more crowded than you think. table 5.8 reports results from a 1969 personal transportation survey on "home-to-work" trips in metropolitan areas. The survey stated that the average car occupancy was 1.4 people. check that calculation.arrow_forward
arrow_back_ios
arrow_forward_ios
Recommended textbooks for you
- A First Course in Probability (10th Edition)ProbabilityISBN:9780134753119Author:Sheldon RossPublisher:PEARSON

A First Course in Probability (10th Edition)
Probability
ISBN:9780134753119
Author:Sheldon Ross
Publisher:PEARSON