A First Course in Probability (10th Edition)
10th Edition
ISBN: 9780134753119
Author: Sheldon Ross
Publisher: PEARSON
expand_more
expand_more
format_list_bulleted
Concept explainers
Topic Video
Question

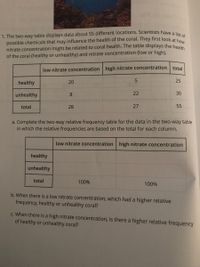
Transcribed Image Text:possible chemicals that may influence the health of the coral. They first look at how
1. The two-way table displays data about 55 different locations. Scientists have a lie
nitrate concentration might be related to coral health. The table displays the hea
of the coral (healthy or unhealthy) and nitrate concentration (low or high).
low nitrate concentration high nitrate concentration total
healthy
20
25
unhealthy
8
22
30
total
28
27
55
a. Complete the two-way relative frequency table for the data in the two-way table
in which the relative frequencies are based on the total for each column.
low nitrate concentration high nitrate concentration
healthy
unhealthy
total
100%
100%
b. When there is a low nitrate concentration, which had a higher relative
frequency, healthy or unhealthy coral?
c. When there is a high nitrate concentration, is there a higher relative frequency
of healthy or unhealthy coral?

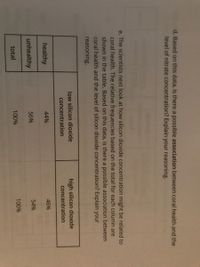
Transcribed Image Text:d. Based on this data, is there a possible association between coral health and the
level of nitrate concentration? Explain your reasoning.
e. The scientists next look at how silicon dioxide concentration might be related to
coral health. The relative frequencies based on the total for each column are
shown in the table. Based on this data, is there a possible association between
coral health and the level of silicon dioxide concentration? Explain your
reasoning.
low silicon dioxide
high silicon dioxide
concentration
concentration
healthy
44%
46%
unhealthy
56%
54%
total
100%
100%
Expert Solution
arrow_forward
Step 1
comment :
Hi! Thank you for the question, As per the honor code, we are allowed to answer three sub-parts at a time so we are answering the first three as you have not mentioned which of these you are looking for. Please re-submit the question separately for the remaining sub-parts.
Two way table :
A two way table is a way to display frequencies or relative frequencies for two categorical variables.
Trending nowThis is a popular solution!
Step by stepSolved in 4 steps

Knowledge Booster
Learn more about
Need a deep-dive on the concept behind this application? Look no further. Learn more about this topic, probability and related others by exploring similar questions and additional content below.Similar questions
- The following table shows the length, in centimeters, of the humerus and the total wingspan, in centimeters, of several pterosaurs, which are extinct flying reptiles. (A graphing calculator is recommended.) Pterosaur Data Humerus, x Wingspan, y Humerus, x Wingspan, y 29 536 32 668 33 677 34 728 27 510 26 497 25 488 24 459 22 455 20 439 1.9 39 1.6 38 1.3 38 1.0 35 0.8 31 (a) Find the equation of the least-squares regression line for the data. Round constants to the nearest hundredth. ў 3 (b) Use the equation from part (a) to determine, to the nearest cen eter, the projected wingspan of a pterosaur if its humerus is 49 centimeters. cmarrow_forwardDoctors are interested in the relationship between the dosage of a medicine and the time required for a patient's recovery. Table 2 shows, for a sample of 10 patients, dosage levels (in grams) and recovery times (in hours). These patients have similar characteristics except for medicine dosages. Table 2: Dosage Level and Recovery Time Patient Dosage Level Recovery Time 1 1.2 25 2 1.3 28 3 1.0 40 4 1.4 38 1.5 10 6. 1.8 9. 7 1.2 27 8. 1.3 30 9. 1.4 16 10 1.3 18 a. Estimate the linear regression of recovery time on dosage level. b. Compute R2 and interpret it. c. Perform an F test of goodness of fit at the 5% significance level.arrow_forwarda)Percentage the table based on the values of the independent variable. b) explain what the table represents and use the percentages to help your claim. *image attached with tablearrow_forward
- B please. Table includedarrow_forwardPlease answer the following question: Is there any relationship between the type of malaria and the tropical zone of contagious?arrow_forwardThe best predicted weight for a bear with a chest size of 51 inches is ? pounds. Is the result close to the actual weight of 452 pounds? A. This result is very close to the actual weight of the bear. B. This result is close to the actual weight of the bear. C. This result is not very close to the actual weight of the bear. D. This result is exactly the same as the actual weight of the bear.arrow_forward
- The above figure shows variations and means of data sets A and B visually. Which of the following statement is TRUE about this figure? answer choices 1.Means of data sets A and B are different. 2.Variations of both data sets are same. 3.Data set A has higher variation than data set B. 4.Data set B has higher variation than data set A.arrow_forward2. A real estate expert wanted to find the relationship between the sale price of houses and various characteristics of the houses. He collected data on five variables, recorded in the table, for 12 houses that were sold recently. The five variables are: Sale price of a house in thousands of dollars. Size of the lot in acres. Price: Lot Size: Living Area: Living area in square feet. Age: Type of house: town house (T) or Villa (V) Age of a house in years. Living Area Price Lot Size Age Туре of house 255 1.4 2500 8 T 178 0.9 2250 12 263 1.8 2900 127 0.7 1800 24 305 2.6 3200 10 164 1.2 2400 18 245 2.1 2700 9 146 1.1 2050 28 287 2.8 2850 13 189 1.6 2600 9 211 1.7 2300 8. 123 0.5 1700 11 a) Find the general regression equation b) Which independent variables are linearly related to price? c) How is the fit of the model? E BBBB BB>>}>> >{arrow_forwardAn economic organization tracks summary statistics of various countries. These include GDP (gross domestic product per capita) and trade balances (measured as a percentage of GDP). Exporting countries tend to have large positive trade balances. Importers have negative balances. The data are shown in the accompanying table. Formulate the SRM with GDP as the response and Trade Balance as the explanatory variable. Complete parts (a) through (c) below. Click the icon to view the data table. (a) Country X reported the highest positive balance of trade, 24.2% of GDP and per capita GDP equal to $63,000. Fit the least squares equation both with and without country X and compare the results. Does the fitted slope change by very much? Find the least squares equation without country X. Complete the equation below. Estimated GDP ($ per cap) = ☐ ☐ Trade Bal (%GDP) (Round to the nearest integer as needed.) Data Table - X Trade Balance (%GDP) GDP ($ per capita) -6.3 16,876 15.7 44,932 -0.9 9,334 -7.9…arrow_forward
- 4. What graphical display is the most suitable to show whether there is a relationship between the age of a person and the number of hours per week spent on exercising?arrow_forwardMatch the definition to the correct vocabulary word. 1. a statistical tool that shows the observed frequencies of two variables; one variable is listed in a row and another variable is listed in columns 2. when a relative frequency is determined by a row or column 3. the ratio of a frequency of a particular category to the entire set of data 4. the ratio of the sum of the joint frequencies in a row of a column over the total number of data values 5. the ratio of individual occurrences over the total occurrences a. joint frequency b. relative frequency c. marginal frequency d. two-way table e. conditional relative frequencyarrow_forward2. A real estate expert wanted to find the relationship between the sale price of houses and various characteristics of the houses. He collected data on five variables, recorded in the table, for 12 houses that were sold recently. The five variables are: Sale price of a house in thousands of dollars. Size of the lot in acres. Price: Lot Size: Living Area: Living area in square feet. Age: Type of house: town house (T) or Villa (V) Age of a house in years. Price Lot Size Living Area Age Туре of house 255 1.4 2500 8 T 178 0.9 2250 12 T T. T. T. 263 1.8 2900 5 0.7 2.6 127 1800 24 305 3200 10 164 1.2 2400 18 245 2.1 2700 T V 146 1.1 2050 28 287 2.8 2850 13 V 189 1.6 2600 9 211 1.7 2300 8 V 123 0.5 1700 11 V a) Find the regression equation for the town house b) Find the regression equation for the Villa c) What is the price of a town house with a lot size of 1.3, living area of 1800, and is 7 years old? EBBBBE A> >}>l> >{arrow_forward
arrow_back_ios
SEE MORE QUESTIONS
arrow_forward_ios
Recommended textbooks for you
 A First Course in Probability (10th Edition)ProbabilityISBN:9780134753119Author:Sheldon RossPublisher:PEARSON

A First Course in Probability (10th Edition)
Probability
ISBN:9780134753119
Author:Sheldon Ross
Publisher:PEARSON
