
MATLAB: An Introduction with Applications
6th Edition
ISBN: 9781119256830
Author: Amos Gilat
Publisher: John Wiley & Sons Inc
expand_more
expand_more
format_list_bulleted
Related questions
Question
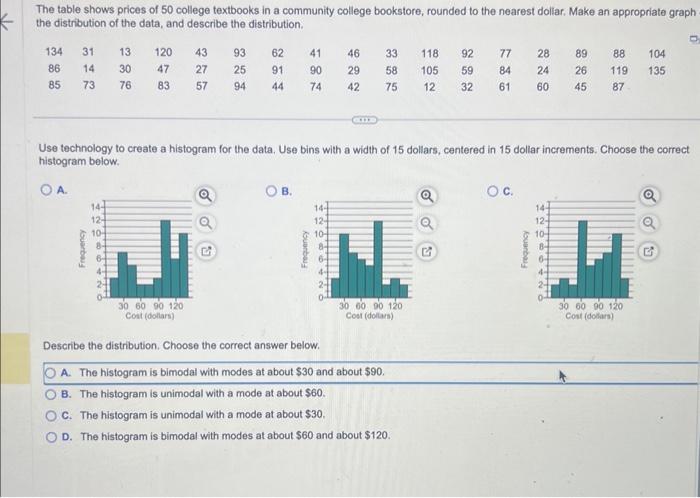

Transcribed Image Text:The table shows prices of 50 college textbooks in a community college bookstore, rounded to the nearest dollar. Make an appropriate graph
the distribution of the data, and describe the distribution.
134 31
86
14
85
73 76
Frequency
13
120
30 47
83
14-
12-
10
84
43
27
57
30 60 90 120
Cost (dollars)
93
62
25 91
94
44
Q
Use technology to create a histogram for the data. Use bins with a width of 15 dollars, centered in 15 dollar increments. Choose the correct
histogram below.
O А.
OB.
41
90
74
Frequency
144
12-
46 33 118 92
29 58 105
75
42
12
10-
8-
64
4-
CILE
30 60 90 120
Cost (dollars)
Describe the distribution. Choose the correct answer below.
OA. The histogram is bimodal with modes at about $30 and about $90.
B. The histogram is unimodal with a mode at about $60.
C. The histogram is unimodal with a mode at about $30.
D. The histogram is bimodal with modes at about $60 and about $120.
77 28
59 84 24
32 61 60
G
O.C.
fouanbau
89 88 104
26 119 135
45 87
144
12-
10-
8-
6-
30 60 90 120
Cost (dollars)
Q
OU
Expert Solution
This question has been solved!
Explore an expertly crafted, step-by-step solution for a thorough understanding of key concepts.

This is a popular solution

Trending nowThis is a popular solution!

Step by stepSolved in 3 steps with 2 images

Knowledge Booster

Similar questions
- Please help me answer in fullarrow_forwardThe data represent the time, in minutes, spent reading a political blog in a day. Construct a frequency distribution using 5 classes. In the table, include the midpoints, relative frequencies, and cumulative frequencies. Which class has the greatest frequency and which has the least frequency? 15 14 4 7 19 1 16 1 12 17 17 18 14 10 10 Complete the table, starting with the lowest class limit. (Simplify your answers.) Relative Frequency Cumulative Frequency Class Frequency Midpoint Which class has the greatest frequency? The class with the greatest frequency is from to. Which class has the least frequency? The class with the least frequency is from toarrow_forwardThe data represent the time, in minutes, spent reading a political blog in a day. Construct a frequency distribution using 5 classes. In the table, include the midpoints, relative frequencies, and cumulative frequencies. Which class has the greatest frequency and which has the least frequency? 14 5 11 2 3 19 6 15 15 18 1 18 11 4 13 0 14 6 12 16 Complete the table, starting with the lowest class limit. (Simplify your answers.) Class Frequency Midpoint Relative Frequency Cumulative Frequency nothing-nothing nothing nothing nothing nothing nothing-nothing nothing nothing nothing nothing nothing-nothing nothing nothing nothing nothing nothing-nothing nothing nothing nothing nothing nothing-nothing nothing nothing nothing nothing Which class has…arrow_forward
- The data represent the time, in minutes, spent reading a political blog in a day. Construct a frequency distribution using 5 classes. In the table, include the midpoints, relative frequencies, and cumulative frequencies. Which class has the greatest frequency and which has the least frequency? 8 8 36 14 31 39 32 36 19 3 4 25 26 12 16 9 Complete the table, starting with the lowest class limit. (Simplify your answers.) Relative Cumulative Class Frequency Midpoint Frequency Frequency Which class has the greatest frequency? The class with the greatest frequency is from to Which class has the least frequency? The class with the least frequency is from | toarrow_forwardResearchers wondered whether the size of a person's brain was related to the individual's mental capacity. They selected a sample of 5 females and 5 males and measured their MRI image pixel counts and IQ scores. Females Males MRI IQ MRI IG The data is reported to the right. Complete parts (a) through (d) below 139 858,472 140 955,003 935,494 924,059 1.079.550 1,001.121 Click the icon to view the critical values table. 991,305 138 141 857,782 833,868 790,619 133 135 132 141 135 140 AMRI 1,080,000- AIO 145 AIO 145- AMRI 1,080,000 780,000 130 130 780,000 130 780,000 780,000 130 1,080,000 145 1,080,000 MRI 145 MRI (b) Compute the linear correlation coefficient between MRI count and IQ. Are MRI count and IQ linearly related? Select the correct choice below and, if necessary, fill in the answer box to complete your choice. (Round to three decimal places as needed.) A. Yes, MRI count and IQ are linearly related since the linear correlation coefficient is O B. No. MRI count and IQ are not…arrow_forwardThe data represent the time, in minutes, spent reading a political blog in a day. Construct a frequency distribution using 5 classes. In the table, include the midpoints, relative frequencies, and cumulative frequencies. Which class has the greatest frequency and which has the least frequency? Complete the table, starting with the lowest class limit. (Simplify your answers.) Class Frequency Midpoint 3.5 0- 6 14 5 10 Relative Frequency 13 5 23 13 19 0 25 3 21 38 5 Cumulative Frequency 39 39 20 29 narrow_forward
- Use the Histogram tool to develop a frequency distribution and histogram for the number of months as a customer of the bank in the data below. Compute the relative and cumulative relative frequencies and use a line chart to construct an ogive. Complete the frequency distribution for the months as a customer, and compute the relative and cumulative relative frequencies. (Type integers or decimals rounded to three decimal places as needed.) Bins Frequency Relative Frequency Cumulative Relative Frequency 10 enter your response here enter your response here enter your response here 20 enter your response here enter your response here enter your response here 30 enter your response here enter your response here enter your response here 40 enter your response here enter your response here enter your response here 50 enter your response here enter your response here enter your…arrow_forwardThe data represent the time, in minutes, spent reading a political blog in a day. Construct a frequency distribution using 5 classes. In the table, include the midpoints, relative frequencies, and cumulative frequencies. Which class has the greatest frequency and which has the least frequency? Complete the table, starting with the lowest class limit. (Simplify your answers.) Class 0-0 Frequency Midpoint 150 187 Relative Frequency 10 7 19 0 1338 1 0 10 5 0 3180 11 Cumulative Frequencyarrow_forwardThe data represent the time, in minutes, spent reading a political blog in a day. Construct a frequency distribution using 5 classes. In the table, include the midpoints, relative frequencies, and cumulative frequencies. Which class has the greatest frequency and which has the least frequency? Complete the table, starting with the lowest class limit. (Simplify your answers.) Class 7.7 Frequency Midpoint 8 3 13 19 Relative Frequency 19 8 17 18 2 1 9 12 18 16 2 0 8895 19 Cumulative Frequencyarrow_forward
- E Use a stem-and-leaf plot that has two rows for each stem to display the data, which represent the income (in millions) of 30 of the highest paid athletes. Describe any patterns. 76 45 34 35 36 44 50 35 56 56 44 43 81 53 38 73 68 46 63 38 87 34 34 42 45 58 Determine the leaves in the stem-and-leaf plot below. Key: 313-33 Income ($ millions) 3 What best describes the data? 站 F2 R OA. Most of the incomes are less than 60 million dollars. OB. Most of the incomes are between 50 and 70 million dollars. OC. The incomes are evenly spread between 30 and 90 million dollars. OD. Most of the incomes are greater than 60 million dollars. V % 5 F4 T G B Y H N F5 46 53 U J 37 41 F6 ( 8 M K 9 F8 L P Alt Gr DELL F9 N F10 TE F11 1 T F12 - Intro Power Impant Sleep Pet Sis Insert Blog Despl Wake ONLOFF Supr Inicioarrow_forwardDescribe the data’s distribution. Number of products owned Millions of People 0 27 1 9 2 7 3-4 7 5 5arrow_forwardThe table shows the magnitudes of the earthquakes that have occurred in the past 10 years. Use the frequency distribution to construct a histogram. Does the histogram appear to be skewed? If so, identify the type of skewness. Construct the histogram. Choose the correct graph below. OA. 15- 10- 5- 0- 6 10 Earthquake magnitude Earthquake Magnitude Frequency Frequency The histogram Earthquake magnitude 5.0-5.9 6.0-6.9 7.0-7.9 8.0-8.9 9.0-9.9 O B. O D. 10 ▼so the distribution of the data is Frequency Frequency Frequency 14 13. 8 4 1 ܗ ܘ ܗ ܘ ܂ 15- ܩ ܘ ܩ SOSO 15 10- 5- 0- Earthquake Magnitude 9 Earthquake magnitude 10 10arrow_forward
arrow_back_ios
arrow_forward_ios
Recommended textbooks for you
- MATLAB: An Introduction with ApplicationsStatisticsISBN:9781119256830Author:Amos GilatPublisher:John Wiley & Sons Inc
 Probability and Statistics for Engineering and th...StatisticsISBN:9781305251809Author:Jay L. DevorePublisher:Cengage Learning
 Statistics for The Behavioral Sciences (MindTap C...StatisticsISBN:9781305504912Author:Frederick J Gravetter, Larry B. WallnauPublisher:Cengage Learning
  Elementary Statistics: Picturing the World (7th E...StatisticsISBN:9780134683416Author:Ron Larson, Betsy FarberPublisher:PEARSON
 The Basic Practice of StatisticsStatisticsISBN:9781319042578Author:David S. Moore, William I. Notz, Michael A. FlignerPublisher:W. H. Freeman
 Introduction to the Practice of StatisticsStatisticsISBN:9781319013387Author:David S. Moore, George P. McCabe, Bruce A. CraigPublisher:W. H. Freeman
MATLAB: An Introduction with Applications
Statistics
ISBN:9781119256830
Author:Amos Gilat
Publisher:John Wiley & Sons Inc
Probability and Statistics for Engineering and th...
Statistics
ISBN:9781305251809
Author:Jay L. Devore
Publisher:Cengage Learning
Statistics for The Behavioral Sciences (MindTap C...
Statistics
ISBN:9781305504912
Author:Frederick J Gravetter, Larry B. Wallnau
Publisher:Cengage Learning
Elementary Statistics: Picturing the World (7th E...
Statistics
ISBN:9780134683416
Author:Ron Larson, Betsy Farber
Publisher:PEARSON
The Basic Practice of Statistics
Statistics
ISBN:9781319042578
Author:David S. Moore, William I. Notz, Michael A. Fligner
Publisher:W. H. Freeman
Introduction to the Practice of Statistics
Statistics
ISBN:9781319013387
Author:David S. Moore, George P. McCabe, Bruce A. Craig
Publisher:W. H. Freeman