
MATLAB: An Introduction with Applications
6th Edition
ISBN: 9781119256830
Author: Amos Gilat
Publisher: John Wiley & Sons Inc
expand_more
expand_more
format_list_bulleted
Related questions
Question
thumb_up100%
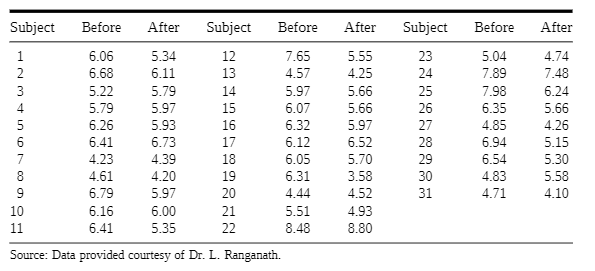
Noting the paucity of information on the effect of estrogen on platelet membrane fatty acid composition, Ranganath et al. (A-48) conducted a study to examine the possibility that changes may be present in postmenopausal women and that these may be reversible with estrogen treatment. The 31 women recruited for the study had not menstruated for at least 3 months or had symptoms of the menopause. No woman was on any form of hormone replacement therapy (HRT) at the time she was recruited. Table 5 shows the platelet membrane linoleic acid values before and after a period of HRT. What is the upper limit of CI? 4 decimal places

Transcribed Image Text:Subject
Before
After
Subject
Before
After
Subject
Before
After
6.06
5.34
12
7.65
5.55
23
5.04
4.74
2
6.68
6.11
13
4.57
4.25
24
7.89
7.48
3
5.22
5.79
14
5.97
5.66
25
7.98
6.24
5.97
5.93
6.73
4
6.07
5.66
5.79
6.26
15
26
6.35
5.66
16
6.32
5.97
27
4.85
4.26
6.52
5.70
6.41
17
6.12
28
6.94
5.15
7
4.23
4.39
18
6.05
29
6.54
5.30
8
3.58
4.61
6.79
4.20
19
6.31
30
4.83
5.58
9
5.97
20
4.44
4.52
31
4.71
4.10
10
6.16
6.00
21
5.51
4.93
11
6.41
5.35
22
8.48
8.80
Source: Data provided courtesy of Dr. L. Ranganath.
Expert Solution
This question has been solved!
Explore an expertly crafted, step-by-step solution for a thorough understanding of key concepts.

This is a popular solution

Trending nowThis is a popular solution!

Step by stepSolved in 2 steps with 4 images

Knowledge Booster

Similar questions
- According to the USDA, 46.2% of males between 20 and 39 years old consume the minimum daily requirement of calcium. After an aggressive “Got Milk?” campaign, the USDA conducts a survey of 48 randomly selected males between the ages of 20 and 39 and finds that 32 of them consume the recommended daily allowance of calcium. At the alpha=0.10 level, is there evidence to conclude that the percentage of males between the ages of 20 and 39 who consume the minimum recommended daily allowance of calcium has increased?arrow_forwardA clinical trial is conducted to compare an experimental medication to placebo to reduce the symptoms of asthma. Two hundred participants are enrolled in the study and randomized to receive either the experimental medication or placebo. The primary outcome is self-reported reduction of symptoms. Among 100 participants who receive the experimental medication, 38 report a reduction of symptoms as compared to 21 participants of 100 assigned to placebo. When you test if there is a significant difference in the proportions of participants reporting a reduction of symptoms between the experimental and placebo groups. Use α = 0.05. What should the researcher’s conclusion be for a 5% significance level? Reject H0because 2.64 ≥ 1.960. We have statistically significant evidence at α = 0.05 to show that there is a difference in the proportions of patients reporting a reduction in symptoms. We reject H0 at the 5% level because 2.64 is greater than 1.96. We do have statistically…arrow_forwardA pharmaceutical company has developed a new drug called Antisubcillin to treat substance use disorder. They have just completed an experiment assessing the safety of the drug. To test safety, 100 rats were given 20 mg of Antisubcillin and 100 rats were given a placebo. The study was conducted as a double-blind controlled study and so the researchers did not know which rats were receiving the drug and which were receiving the placebo. The number of negative side effects displayed by each rat over the course of 8 weeks was recorded. Which statistical test should be used to analyze these data? z test one-sample t test independent samples t test dependent samples t testarrow_forward
- A clinical trial is conducted to compare an experimental medication to placebo to reduce the symptoms of asthma. Two hundred participants are enrolled in the study and randomized to receive either the experimental medication or placebo. The primary outcome is self-reported reduction of symptoms. Among 100 participants who receive the experimental medication, 38 report a reduction of symptoms as compared to 21 participants of 100 assigned to placebo. When you test if there is a significant difference in the proportions of participants reporting a reduction of symptoms between the experimental and placebo groups. Use α = 0.05. What should the researcher’s conclusion be for a 5% significance level? Reject H0because 2.64 ≥ 1.960. We have statistically significant evidence at α = 0.05 to show that there is a difference in the proportions of patients reporting a reduction in symptoms. We reject H0 at the 5% level because 2.64 is greater than 1.96. We do have statistically…arrow_forwardIn 2015, a survey found that 38% of Americans were supportive of online education for elementary and secondary education. With the increase in contagious viruses, it is of interest if this proportion has changed. In a 2019 poll, 51% of 1028 Americans were supportive of online education for elementary and secondary education. At the 10% significance level, do the data provide sufficient evidence to conclude that the percentage of all American adults who support online education for elementary and secondary education has changed from what was believed in 2015? Choose the choice that gives the null and alternative hypothesis.arrow_forwardResearchers studying the link between prenatal vitamin use and autism surveyed the mothers of a random sample of children aged 24 - 60 months with autism and surveyed another separate random sample for children with typical development. Table summarizing the number of mothers in each group who did and did not use prenatal vitamins during the three months before pregnancy (data from Schmidt, 2011) Autism Typical Development Total No vitamin 111 70 181 Vitamin 143 159 302 Total 254 229 483 Complete the hypothesis test for independence between the two variables, use of prenatal vitamins during the three months before pregnancy and autism in Rguroo. What is the value of the test statistic for this test? (Use the Large Sample Z method and please round to two decimal places)arrow_forward
- A study was conducted to examine the effects of yoga on feelings of anxiety and stress among 200 college students. 100 students were randomized to participate in daily yoga exercises in the morning, while the remaining 100 students were attended a wellness course that described the benefits of yoga and exercise on one's health. At the end of the study, it was determined that those who participated in daily yoga exercises had fewer symptoms of anxiety and stress compared to those who attended the wellness course. la. What is the study design that the investigators used? a. Case report b. Case series c. Ecological Study d. Cross-sectional (descriptive) e. Cross-sectional (analytic) f. Case-control study g. Retrospective cohort study h. Prospective cohort study i. Randomized clinical trial Ib-Would blinding have been feasible for this study? If yes, who could have been blinded? Circle all that apply. a. Subjects/Students b. Investigators c. Data analystsarrow_forwardMore than 10% of people carry the parasite Toxoplasma gondii. The life-long presence of Toxoplasma cysts in neural and muscular tissues leads to prolongation of reaction times in infected subjects. The following table gives data from Prague on 15- to 29-year-old drivers who had been and had not been involved in accidents. The table also gives the number of drivers who were infected with Toxoplasma gondii and who were uninfected. Infected Uninfected Drivers with accidents 21 38 Drivers without accidents 38 211 Source: Flegr. J Havlicek, J., Kodym, P. Malý, M. & Smahel, Z. (2002). Increased risk of traffic accidents in subjects with latent toxoplasmosis: a retrospective case- control study. BMC infectious diseasex, 2, 11. https://doi.org/10.1186/1471-2334-2-11 Complete the sentences to form the correct statements identifying the explanatory and response variables. Select from here: infection status. The explanatory variable is place of living. accident state. The response variable is age…arrow_forwardA study was made of 413 children who were hospitalized as a result of motor vehicle crashes. Among 290 children who were not using seat belts, 60 were injured severely. Among 123 children using seat belts, 16 were injured severely (based on data from "Morbidity Among Pediatric Motor Vehicle Crash Victims: The Effectiveness of Seat Belts," by Osberg and Di Scala, American Journal of Public Health, Vol. 82, No. 3). For this problem we want to know, is there sufficient sample evidence to conclude, at the 0.05 significance level, that the proportion of severe injuries is higher for children not wearing seat belts? Let pi be the proportion of severe injuries among all children not wearing seatbelts and who were involved in crashes. Let p2 be the proportion of severe injuries among all children wearing seatbelts and who were involved in crashes. Which is the proper expression of Ho? Pi = P2 O Pi P2 Which is the proper expression of H1? O pi P2 Calculate p1 to 4 decimal places: Calculate p,…arrow_forward
arrow_back_ios
arrow_forward_ios
Recommended textbooks for you
- MATLAB: An Introduction with ApplicationsStatisticsISBN:9781119256830Author:Amos GilatPublisher:John Wiley & Sons Inc
 Probability and Statistics for Engineering and th...StatisticsISBN:9781305251809Author:Jay L. DevorePublisher:Cengage Learning
 Statistics for The Behavioral Sciences (MindTap C...StatisticsISBN:9781305504912Author:Frederick J Gravetter, Larry B. WallnauPublisher:Cengage Learning
  Elementary Statistics: Picturing the World (7th E...StatisticsISBN:9780134683416Author:Ron Larson, Betsy FarberPublisher:PEARSON
 The Basic Practice of StatisticsStatisticsISBN:9781319042578Author:David S. Moore, William I. Notz, Michael A. FlignerPublisher:W. H. Freeman
 Introduction to the Practice of StatisticsStatisticsISBN:9781319013387Author:David S. Moore, George P. McCabe, Bruce A. CraigPublisher:W. H. Freeman
MATLAB: An Introduction with Applications
Statistics
ISBN:9781119256830
Author:Amos Gilat
Publisher:John Wiley & Sons Inc
Probability and Statistics for Engineering and th...
Statistics
ISBN:9781305251809
Author:Jay L. Devore
Publisher:Cengage Learning
Statistics for The Behavioral Sciences (MindTap C...
Statistics
ISBN:9781305504912
Author:Frederick J Gravetter, Larry B. Wallnau
Publisher:Cengage Learning
Elementary Statistics: Picturing the World (7th E...
Statistics
ISBN:9780134683416
Author:Ron Larson, Betsy Farber
Publisher:PEARSON
The Basic Practice of Statistics
Statistics
ISBN:9781319042578
Author:David S. Moore, William I. Notz, Michael A. Fligner
Publisher:W. H. Freeman
Introduction to the Practice of Statistics
Statistics
ISBN:9781319013387
Author:David S. Moore, George P. McCabe, Bruce A. Craig
Publisher:W. H. Freeman