MATLAB: An Introduction with Applications
6th Edition
ISBN: 9781119256830
Author: Amos Gilat
Publisher: John Wiley & Sons Inc
expand_more
expand_more
format_list_bulleted
Question

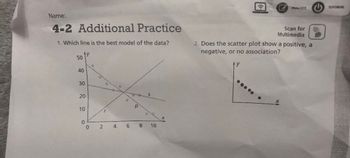
Transcribed Image Text:Name:
4-2 Additional Practice
1. Which line is the best model of the data?
ty
50
40
30
20
10
0
0
0 2
O
r
4
O
6
p
8
O
S
10
X
PRACTICE
●●●●●
Scan for
Multimedia
2. Does the scatter plot show a positive, a
negative, or no association?
TUTORIAL
Expert Solution
This question has been solved!
Explore an expertly crafted, step-by-step solution for a thorough understanding of key concepts.
This is a popular solution
Trending nowThis is a popular solution!
Step by stepSolved in 3 steps

Knowledge Booster
Similar questions
- lecture(11.12): A large amount of scatter in a scatter plot is an indication that the relationship between the two variables is (a) negative (b) strong (c) weak (d) moderate (e) positivearrow_forwardWhat would it be for the histogram box?arrow_forwardA researcher measures the relationship between education (in years) and investment gains (in thousands of dollars). Answer the following questions based on the results provided. SP = 16.25. a. Create a scatter plot of the data & Calculate r and r2b. Report results in APA style & What do results mean? Education Investment Gains 14 8 12 11 9 10 18 14arrow_forward
- (a) Find the five-number summary, and (b) draw a box-and-whisker plot of the data. 38 85 2 986 95 94 25 29 8 6 6 9 □ (a) Min = 2 (Simplify your answer.) Q₁ = (Simplify your answer.)arrow_forwardI need help with the questions 2a,2b and 2c. Describe the shape of the distribution of the data. Which movie has the largest budget With all the data obtained, which genre movie tend to have larger budgets.arrow_forwardwhich box plot best represents the data?arrow_forward
- The following is data for the first and second Quiz scores for 8 students in a class. First Quiz (Q1) Second Quiz (Q2) 15 15 16 13 17 15 22 21 24 24 26 21 29 27 30 27 Plot the points in the grid below, then sketch a line that best fits the data. Use the line above to predict the value of the second quiz score if a student had a score of 1212 on the first test. (Please enter a whole number)arrow_forwardDraw a scatter plot for the data in the following table. -4 -3 -2 -1 0 1 2 3 4 LO y 0.5 3 4.8 6 7.1 7.2 8.3 8.9 9 9.9 9 8 7 6 5 4 3 21 + -4-3 -2 -1 1 2 3 4 5 Clear All Draw: Dotarrow_forwardConstruct a scatter plot from the given points and describe the correlation.arrow_forward
- Consider the data. X; 2 6 9 13 20 Y; 9 2 10 25 22arrow_forwardA physics professor wishes to compare quiz grades between her two classes. The quiz was worth 10 points. The dot plots show the grade distributions. 4 10 9. Class A 10 Class B Each dot represents a What was the lowest quiz grade in Class A? What was the highest quiz grade in Class 8?arrow_forward
arrow_back_ios
arrow_forward_ios
Recommended textbooks for you
 MATLAB: An Introduction with ApplicationsStatisticsISBN:9781119256830Author:Amos GilatPublisher:John Wiley & Sons Inc
 Probability and Statistics for Engineering and th...StatisticsISBN:9781305251809Author:Jay L. DevorePublisher:Cengage Learning
 Statistics for The Behavioral Sciences (MindTap C...StatisticsISBN:9781305504912Author:Frederick J Gravetter, Larry B. WallnauPublisher:Cengage Learning
 Elementary Statistics: Picturing the World (7th E...StatisticsISBN:9780134683416Author:Ron Larson, Betsy FarberPublisher:PEARSON
 The Basic Practice of StatisticsStatisticsISBN:9781319042578Author:David S. Moore, William I. Notz, Michael A. FlignerPublisher:W. H. Freeman
 Introduction to the Practice of StatisticsStatisticsISBN:9781319013387Author:David S. Moore, George P. McCabe, Bruce A. CraigPublisher:W. H. Freeman

MATLAB: An Introduction with Applications
Statistics
ISBN:9781119256830
Author:Amos Gilat
Publisher:John Wiley & Sons Inc

Probability and Statistics for Engineering and th...
Statistics
ISBN:9781305251809
Author:Jay L. Devore
Publisher:Cengage Learning

Statistics for The Behavioral Sciences (MindTap C...
Statistics
ISBN:9781305504912
Author:Frederick J Gravetter, Larry B. Wallnau
Publisher:Cengage Learning

Elementary Statistics: Picturing the World (7th E...
Statistics
ISBN:9780134683416
Author:Ron Larson, Betsy Farber
Publisher:PEARSON

The Basic Practice of Statistics
Statistics
ISBN:9781319042578
Author:David S. Moore, William I. Notz, Michael A. Fligner
Publisher:W. H. Freeman

Introduction to the Practice of Statistics
Statistics
ISBN:9781319013387
Author:David S. Moore, George P. McCabe, Bruce A. Craig
Publisher:W. H. Freeman