
MATLAB: An Introduction with Applications
6th Edition
ISBN: 9781119256830
Author: Amos Gilat
Publisher: John Wiley & Sons Inc
expand_more
expand_more
format_list_bulleted
Related questions
Question

Transcribed Image Text:5:40 1
myopenmath.com
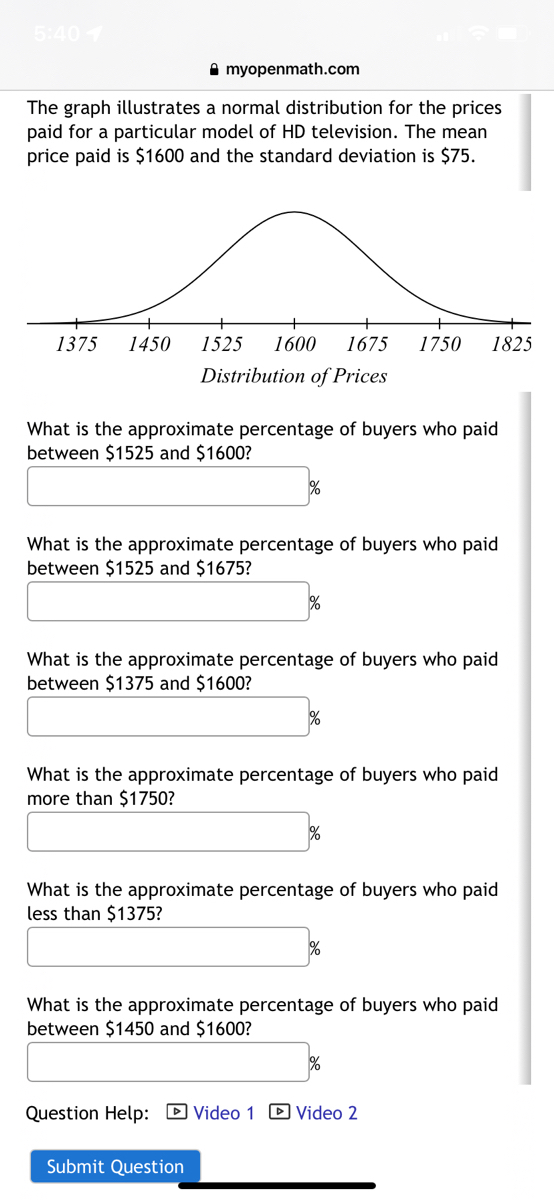
The graph illustrates a normal distribution for the prices
paid for a particular model of HD television. The mean
price paid is $1600 and the standard deviation is $75.
1375 1450 1525 1600 1675 1750 1825
Distribution of Prices
What is the approximate percentage of buyers who paid
between $1525 and $1600?
%
What is the approximate percentage of buyers who paid
between $1525 and $1675?
What is the approximate percentage of buyers who paid
between $1375 and $1600?
What is the approximate percentage of buyers who paid
more than $1750?
%
What is the approximate percentage of buyers who paid
less than $1375?
Submit Question
%
What is the approximate percentage of buyers who paid
between $1450 and $1600?
%
Question Help: Video 1 Video 2
Expert Solution
This question has been solved!
Explore an expertly crafted, step-by-step solution for a thorough understanding of key concepts.

This is a popular solution

Trending nowThis is a popular solution!

Step by stepSolved in 3 steps with 8 images

Knowledge Booster

Similar questions
- The distribution of the number of hours that a random sample of people spend doing chores per week is shown in the pie chart. Use 32 as the midpoint for "30+ hours." Make a frequency distribution for the data. Then use the table to estimate the sample mean and the sample standard deviation of the data set. W Click the icon to view the pie chart. ..... 5-9 12 10-14 23 15-19 16 20-24 18 25-29 12 30+ 4 Find an approximation for the sample mean. x= 16.6 (Type an integer or decimal rounded to the nearest tenth as needed.) Find an approximation for the sample standard deviation. s= (Type an integer or decimal rounded to the nearest tenth as needed.)arrow_forward(See photo) The data set on the left represents the annual rate of return (in percent) of eight randomly sampled bond mutual funds, and the data set on the right represents the annual rate of return (in percent) of eight randomly sampled stock mutual funds. What proportion of the observations is within one standard deviation of the mean for each data set?arrow_forward
Recommended textbooks for you
- MATLAB: An Introduction with ApplicationsStatisticsISBN:9781119256830Author:Amos GilatPublisher:John Wiley & Sons Inc
 Probability and Statistics for Engineering and th...StatisticsISBN:9781305251809Author:Jay L. DevorePublisher:Cengage Learning
 Statistics for The Behavioral Sciences (MindTap C...StatisticsISBN:9781305504912Author:Frederick J Gravetter, Larry B. WallnauPublisher:Cengage Learning
  Elementary Statistics: Picturing the World (7th E...StatisticsISBN:9780134683416Author:Ron Larson, Betsy FarberPublisher:PEARSON
 The Basic Practice of StatisticsStatisticsISBN:9781319042578Author:David S. Moore, William I. Notz, Michael A. FlignerPublisher:W. H. Freeman
 Introduction to the Practice of StatisticsStatisticsISBN:9781319013387Author:David S. Moore, George P. McCabe, Bruce A. CraigPublisher:W. H. Freeman
MATLAB: An Introduction with Applications
Statistics
ISBN:9781119256830
Author:Amos Gilat
Publisher:John Wiley & Sons Inc
Probability and Statistics for Engineering and th...
Statistics
ISBN:9781305251809
Author:Jay L. Devore
Publisher:Cengage Learning
Statistics for The Behavioral Sciences (MindTap C...
Statistics
ISBN:9781305504912
Author:Frederick J Gravetter, Larry B. Wallnau
Publisher:Cengage Learning
Elementary Statistics: Picturing the World (7th E...
Statistics
ISBN:9780134683416
Author:Ron Larson, Betsy Farber
Publisher:PEARSON
The Basic Practice of Statistics
Statistics
ISBN:9781319042578
Author:David S. Moore, William I. Notz, Michael A. Fligner
Publisher:W. H. Freeman
Introduction to the Practice of Statistics
Statistics
ISBN:9781319013387
Author:David S. Moore, George P. McCabe, Bruce A. Craig
Publisher:W. H. Freeman