MATLAB: An Introduction with Applications
6th Edition
ISBN: 9781119256830
Author: Amos Gilat
Publisher: John Wiley & Sons Inc
expand_more
expand_more
format_list_bulleted
Question

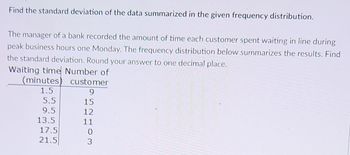
Transcribed Image Text:Find the standard deviation of the data summarized in the given frequency distribution.
The manager of a bank recorded the amount of time each customer spent waiting in line during
peak business hours one Monday. The frequency distribution below summarizes the results. Find
the standard deviation. Round your answer to one decimal place.
Waiting time Number of
(minutes) customer
1.5
9
15
12
11
0
3
5.5
9.5
13.5
17.5
21.5
Expert Solution
This question has been solved!
Explore an expertly crafted, step-by-step solution for a thorough understanding of key concepts.
This is a popular solution
Trending nowThis is a popular solution!
Step by stepSolved in 3 steps with 2 images

Knowledge Booster
Similar questions
- The scores and their percent of the final grade for a statistics student are given. What is the student's weighted mean score? The student's weighted mean score is. (Simplify your answer. Round to two decimal places as needed.) Homework Quiz Quiz Project Final Exam Score Percent of final grade 85 90 90 98 89 15 10 10 35 30arrow_forwardThe decrease in cholesterol level (in mg/dL) for ten individuals are listed below. Calculate the range of the data. 16 22 17 18 22 19 21 20 18 23arrow_forwardThe following histogram displays data from a cable repair company's in-home service calls. The technicians were asked to record how long each visit took. Approximately what percentage of service calls lasted less than 60 minutes? Round you answer to the nearest percent. Frequency 50- 40- 30 20- 10- 16 62-0 37 30-59 42 60-89 16 Or 90-119 Duration of a visit, mins 40 120-149 24 150-179arrow_forward
- Approximate the mean of the frequency distribution for the ages of the residents of a town. Age Frequency 0-9 20 10-19 37 20-29 22 30-39 24 40-49 31 50-59 48 60-69 35 70-79 14 80-89 3 The approximate mean age is= years. (Round to one decimal place as needed.)arrow_forwardApproximate the mean of the frequency distribution for the ages of the residents of a town. Age Frequency 0-9 31 10-19 27 20-29 14 30-39 20 40-49 22 50-59 43 60-69 46 70-79 11 80-89 7 What is the approximate mean age in years.arrow_forwardA Fun-Size bag of M&M's contains 5 green, 4 red, 3 yellow, 6 orange, 4 blue, and 2 brown candies. Construct a relative frequency table of the results. Use two decimal places in your relative frequencies. Color Proportion Green i Red i Yellow i Orange Blue i Brown Total 1.00arrow_forward
- Solve for the slope, y-intercept, equation of the trend line, the correlation coefficient, and the coefficient of determination for the following the data set. Show your work and explain the steps you used to solve. Round your answer to the nearest hundredth. Save Goals Percentage 36 9.61 9.42 9.35 DELL 58 66arrow_forwardWrite one paragraph describing the data set using the histogram. Comment on the shape of the distribution of the data.arrow_forwardFind the mean for the recorded exam scores (in points) from a statistics exam. Round the answer to one decimal place. 36 34 92 60 55 79 74 30 Mean = 21 39 11 64 88 67 53arrow_forward
- The scores and their percent of the final grade for a statistics student are given. What is the student's weighted mean score? The student's weighted mean score is (Simplify your answer. Round to two decimal places as needed.) Homework Quiz Quiz Project Final Exam Score Percent of final grade 86 10 83 10 98 10 98 40 89 30arrow_forwardThe gas mileages (in miles per gallon) for 38 cars are shown in the frequency distribution. Approximate the mean of the frequency distribution. The approximate mean of the frequency distribution is (Round to one decimal place as needed.) Gas Mileage (in miles per gallon) 26-30 31-35 36-40 41-45 Frequency 13 14 4 7 0arrow_forwardFind the mean of the data summarized in the given frequency distribution. Compare the computed mean to the actual mean of 57.4 degrees. Low Temperature (o F) 40-44 45-49 50 - 54 Frequency 2 5 10 The mean of the frequency distribution is degrees. (Round to the nearest tenth as needed.) 55-59 4 60-64 3arrow_forward
arrow_back_ios
SEE MORE QUESTIONS
arrow_forward_ios
Recommended textbooks for you
 MATLAB: An Introduction with ApplicationsStatisticsISBN:9781119256830Author:Amos GilatPublisher:John Wiley & Sons Inc
 Probability and Statistics for Engineering and th...StatisticsISBN:9781305251809Author:Jay L. DevorePublisher:Cengage Learning
 Statistics for The Behavioral Sciences (MindTap C...StatisticsISBN:9781305504912Author:Frederick J Gravetter, Larry B. WallnauPublisher:Cengage Learning
 Elementary Statistics: Picturing the World (7th E...StatisticsISBN:9780134683416Author:Ron Larson, Betsy FarberPublisher:PEARSON
 The Basic Practice of StatisticsStatisticsISBN:9781319042578Author:David S. Moore, William I. Notz, Michael A. FlignerPublisher:W. H. Freeman
 Introduction to the Practice of StatisticsStatisticsISBN:9781319013387Author:David S. Moore, George P. McCabe, Bruce A. CraigPublisher:W. H. Freeman

MATLAB: An Introduction with Applications
Statistics
ISBN:9781119256830
Author:Amos Gilat
Publisher:John Wiley & Sons Inc

Probability and Statistics for Engineering and th...
Statistics
ISBN:9781305251809
Author:Jay L. Devore
Publisher:Cengage Learning

Statistics for The Behavioral Sciences (MindTap C...
Statistics
ISBN:9781305504912
Author:Frederick J Gravetter, Larry B. Wallnau
Publisher:Cengage Learning

Elementary Statistics: Picturing the World (7th E...
Statistics
ISBN:9780134683416
Author:Ron Larson, Betsy Farber
Publisher:PEARSON

The Basic Practice of Statistics
Statistics
ISBN:9781319042578
Author:David S. Moore, William I. Notz, Michael A. Fligner
Publisher:W. H. Freeman

Introduction to the Practice of Statistics
Statistics
ISBN:9781319013387
Author:David S. Moore, George P. McCabe, Bruce A. Craig
Publisher:W. H. Freeman