MATLAB: An Introduction with Applications
6th Edition
ISBN: 9781119256830
Author: Amos Gilat
Publisher: John Wiley & Sons Inc
expand_more
expand_more
format_list_bulleted
Question

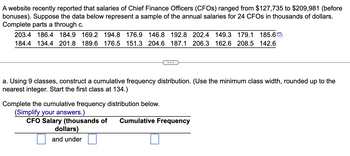
Transcribed Image Text:A website recently reported that salaries of Chief Finance Officers (CFOs) ranged from $127,735 to $209,981 (before
bonuses). Suppose the data below represent a sample of the annual salaries for 24 CFOs in thousands of dollars.
Complete parts a through c.
203.4 186.4 184.9 169.2 194.8 176.9 146.8 192.8 202.4 149.3 179.1
185.6
184.4 134.4 201.8 189.6 176.5 151.3 204.6 187.1 206.3 162.6 208.5 142.6
a. Using 9 classes, construct a cumulative frequency distribution. (Use the minimum class width, rounded up to the
nearest integer. Start the first class at 134.)
Complete the cumulative frequency distribution below.
(Simplify your answers.)
CFO Salary (thousands of Cumulative Frequency
dollars)
and under
Expert Solution
This question has been solved!
Explore an expertly crafted, step-by-step solution for a thorough understanding of key concepts.
Step by stepSolved in 2 steps with 2 images

Follow-up Questions
Read through expert solutions to related follow-up questions below.
Follow-up Question

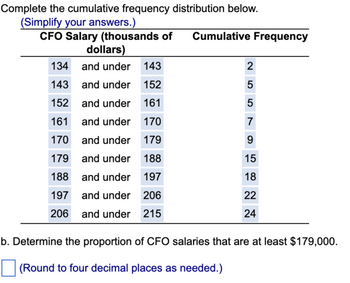
Transcribed Image Text:Complete the cumulative frequency distribution below.
(Simplify your answers.)
CFO Salary (thousands of Cumulative Frequency
dollars)
134
and under 143
143
and under
152
152 and under 161
161
and under 170
170 and under 179
179 and under
188
188
and under
197
197
and under
206
206 and under 215
2
5
5
7
9
15
2
18
22
24
b. Determine the proportion of CFO salaries that are at least $179,000.
(Round to four decimal places as needed.)
Solution
by Bartleby Expert
Follow-up Questions
Read through expert solutions to related follow-up questions below.
Follow-up Question

Transcribed Image Text:Complete the cumulative frequency distribution below.
(Simplify your answers.)
CFO Salary (thousands of Cumulative Frequency
dollars)
134
and under 143
143
and under
152
152 and under 161
161
and under 170
170 and under 179
179 and under
188
188
and under
197
197
and under
206
206 and under 215
2
5
5
7
9
15
2
18
22
24
b. Determine the proportion of CFO salaries that are at least $179,000.
(Round to four decimal places as needed.)
Solution
by Bartleby Expert
Knowledge Booster
Similar questions
- The table below contains the total number of deaths worldwide as a result of earthquakes from 2000 to 2012. Year Total Number of Deaths 2000 231 2001 21,357 2002 11,685 2003 33,819 2004 228,802 2005 88,003 2006 6,605 2007 712 2008 2009, 2010 2011 2012 Total a. C. 88,011 1,790 320, 120 21,953 768 823,856 What is the proportion of deaths between 2007 and 2012? (not including 2007 or 2012; round to 3 decimal places) d. What percent of deaths occurred before 2001? Enter your answer without the percent sign. (round to 3 decimal places) What is the percent of deaths that occurred in 2003 or after 2010? Enter your answer without the percent sign. (Round to 3 decimal places) What is the proportion of deaths that happened before 2012? (Round to 3 decimal places.)arrow_forwardPlease help question 101arrow_forwardConsider the following data from a stock table on the company "Apple Inc." Name Apple Inc. Symbol APPL Close $148.96 Day Range $146.76−$148.98 52-week Range $89.47−$148.98 Volume 27,327,725 P/E 17.88 Dividend $2.52 EPS $? Calculate the earnings per share.arrow_forward
- The table below contains real data for the first two decades of AIDS reporting. Year # AIDS cases diagnosed # AIDS deaths Pre–1981 91 29 1981 319 121 1982 1,170 453 1983 3,076 1,482 1984 6,240 3,466 1985 11,776 6,878 1986 19,032 11,987 1987 28,564 16,162 1988 35,447 20,868 1989 42,674 27,591 1990 48,634 31,335 1991 59,660 36,560 1992 78,530 41,055 1993 78,834 44,730 1994 71,874 49,095 1995 68,505 49,456 1996 59,347 38,510 1997 47,149 20,736 1998 38,393 19,005 1999 25,174 18,454 2000 25,522 17,347 2001 25,643 17,402 2002 26,464 16,371 Total 802,118 489,093 Graph "year" vs. "# AIDS deaths." Do not include pre-1981. Label both axes with words. Scale both axes. Calculate the following. (Round your answers to the nearest whole number. Round the correlation coefficient r to four decimal places.) (a) a = (b) b = (c) r = (d) n =arrow_forwardFind out the next month after april income by using the forecasting method of the moving average methodarrow_forwardRecent BASEBALL Team Payrolls and Wins Team Payroll Wins Boston Red Sox 197.041 93 Cleveland Indians 124.116 102 Los Angeles Angels 166.375 80 New York Yankees 196.39 91 Arizona Diamondbacks 127.829 93 Colorado Rockies 127.829 87 Philadelphia Phillies 100.041 66 San Diego Padres 69.624 71 Detroit Tigers 199.751 64 New York Mets 154.437 70 Seattle Mariners 154.319 78 Chicago Cubs 172.2 92 Atlanta Braves 122.603 72 Milwaukee Brewers 63.061 86 Toronto Blue Jays 163.382 76 Los Angeles Dodgers 241.149 104 Minnesota Twins 108.103 85 St. Louis Cardinals 148.153 83 Oakland Athletics 81.738 75 Texas Rangers 165.348 78 Houston Astros 124.344 101 Washington Nationals 164.335 97 Cincinnati Reds 95.376 68 Chicago White Sox 97.8 67 Miami Marlins 115.406 77 San Francisco Giants 180.823 64 Baltimore Orioles 164.326 75 Kansas City Royals 143.006 80 Pittsburgh Pirates 95.807 75 Tampa Bay Rays 70.065 80 1) If an MLB team spent an additional…arrow_forward
- The following information is taken from Johnson & Johnson's annual reports. Its common stock is listed on the New York Stock Exchange, using the symbol JNJ. Johnson & Johnson Domestic Sales International Sales Employees Year ($ million) ($ million) (thousands) 2010 $ 29,437 $ 32,124 114.0 2011 12,907 36,107 117.9 2012 29,830 37,394 127.6 2013 31,910 39,402 128.1 2014 34,782 39,548 126.5 2015 35,687 34,387 127.1 2016 37,811 34,079 126.4 2017 39,903 36,587 134.0 2018 41,884 39,697 135.1 Using the period 2010–12 as the base period, compute a simple index of domestic sales for each year from 2013 to 2018. (Round your answers to 1 decimal place.)The index (2010–2012 = 100) for selected years is: Year Simple Index 2010 2011 2012 2013 2014 2015 2016 2017 2018arrow_forwardHistorical returns. Calculate the arithmetic average return of U.S. Treasury bills, long-term government bonds, and large-company stocks for 1988 to 1997. Which had the highest return? Which had the lowest return? On the left side, click on the Spreadsheet Leaming Aid to see Table 8.1-Year-by-Year Returns, 1950-1999. What is the average return of U.S. Treasury bills for 1988 to 1997? |% (Round to two decimal places.)arrow_forwardGary is creating an index that helps compare the salaries of two jobs that he is considering. In the table below, what is the 2017 value for the Salary Index of Job 2? Base Salaries (2015-2017) 2015 2016 2017 Job 1 $30,000 $37,000 $39,000 Job 2 $40,000 $45,000 $53,000 Salary Index (2015-2017) 2015 2016 2017 Job 1 100 123 130 Job 2 100 113 ? 133 153 130 123arrow_forward
- The table below contains real data for the first two decades of AIDS reporting. Year # AIDS cases diagnosed # AIDS deaths Pre-1981 91 29 1981 319 121 1982 1,170 453 1983 3,076 1,482 1984 6,240 3,466 1985 11,776 6,878 1986 19,032 11,987 1987 28,564 16,162 1988 35,447 20,868 1989 42,674 27,591 1990 48,634 31,335 1991 59,660 36,560 1992 78,530 41,055 1993 78,834 44,730 1994 71,874 49,095 1995 68,505 49,456 1996 59,347 38,510 1997 47,149 20,736 1998 38,393 19,005 1999 25,174 18,454 2000 25,522 17,347 2001 25,643 17,402 2002 26,464 16,371 Total 802,118 489,093 Graph "year" versus "# AIDS cases diagnosed" (plot the scatter plot). Do not include pre-1981 data. Perform linear regression. Write the equations. (Round your answers to the nearest whole number. Round r to four decimal places.) (a) Linear Equation: 9 - (b) a = (c) b= (d) (e) n-arrow_forwarde_id%3D_2120042_1&group_id%3D&mode%3Dview PROBLEM #2 The table below is a summary of a neighborhood survey. Which of the neighborhoods would you consider the lowest income neighborhood? Explain your answer? TABLE 1 CROWN PROSPECT HEIGHTS, EAST NEW YORK HEIGHTS/ FLATBUSH BED-STUY / BUSHWICK INCOME Count % Count % Count LESS THAN $15,000 45 19.7% 7.8% 11 8.3% $15 000 $24,999 69 30.1% 25 39.1% 38 28.6% $25,000 $34 999 64 27.9% 18 28.1% 40 30.1% $35,000 $44,999 27 11.8% 9.4% 21 15.8% $45.000 OR MORE 24 10.5% 10 15.6% 23 17.3% 1. You must create a new table in MS-Excel to calculate the Midpoints of the Income ranges and calculate the Estimated Weighted Average Income for each of the neighborhoods before you can make a valid decision. 2. For each of the neighborhoods establish a 98% Confidence Interval to estimate the mean income 3. Do you observe any overlaps in the estimated mean incomes between any two neighborhoods? Cance Save Draft Submit 3:59 AM 2Type here to search 6. Rain off and on…arrow_forward3. The Save More Rental Car Agency at the Cincinnati airport would like to examine records from last summer in order to plan for the coming summer demand. The data for last year's demand, broken down by type of vehicle requested, is shown in the table below. Vehicle Type Sub-compact Compact Full-size Frequency 545 892 740 360 280 168 2985 * Total is not equal to 1.000 due to rounding error. Relative Frequency 0.183 0.299 0.248 Luxury SUV Van Total 0.121 0.094 0.056 1.001* a) Construct a frequency and relative frequency bar chart for the data. b) Construct a pie chart to display the information. c) This summer's demand is expected to be 20% higher than demand for last summer. Approximately how many luxury cars are expected to be rented this summer?arrow_forward
arrow_back_ios
SEE MORE QUESTIONS
arrow_forward_ios
Recommended textbooks for you
 MATLAB: An Introduction with ApplicationsStatisticsISBN:9781119256830Author:Amos GilatPublisher:John Wiley & Sons Inc
 Probability and Statistics for Engineering and th...StatisticsISBN:9781305251809Author:Jay L. DevorePublisher:Cengage Learning
 Statistics for The Behavioral Sciences (MindTap C...StatisticsISBN:9781305504912Author:Frederick J Gravetter, Larry B. WallnauPublisher:Cengage Learning
 Elementary Statistics: Picturing the World (7th E...StatisticsISBN:9780134683416Author:Ron Larson, Betsy FarberPublisher:PEARSON
 The Basic Practice of StatisticsStatisticsISBN:9781319042578Author:David S. Moore, William I. Notz, Michael A. FlignerPublisher:W. H. Freeman
 Introduction to the Practice of StatisticsStatisticsISBN:9781319013387Author:David S. Moore, George P. McCabe, Bruce A. CraigPublisher:W. H. Freeman

MATLAB: An Introduction with Applications
Statistics
ISBN:9781119256830
Author:Amos Gilat
Publisher:John Wiley & Sons Inc

Probability and Statistics for Engineering and th...
Statistics
ISBN:9781305251809
Author:Jay L. Devore
Publisher:Cengage Learning

Statistics for The Behavioral Sciences (MindTap C...
Statistics
ISBN:9781305504912
Author:Frederick J Gravetter, Larry B. Wallnau
Publisher:Cengage Learning

Elementary Statistics: Picturing the World (7th E...
Statistics
ISBN:9780134683416
Author:Ron Larson, Betsy Farber
Publisher:PEARSON

The Basic Practice of Statistics
Statistics
ISBN:9781319042578
Author:David S. Moore, William I. Notz, Michael A. Fligner
Publisher:W. H. Freeman

Introduction to the Practice of Statistics
Statistics
ISBN:9781319013387
Author:David S. Moore, George P. McCabe, Bruce A. Craig
Publisher:W. H. Freeman