
MATLAB: An Introduction with Applications
6th Edition
ISBN: 9781119256830
Author: Amos Gilat
Publisher: John Wiley & Sons Inc
expand_more
expand_more
format_list_bulleted
Related questions
Concept explainers
Topic Video
Question
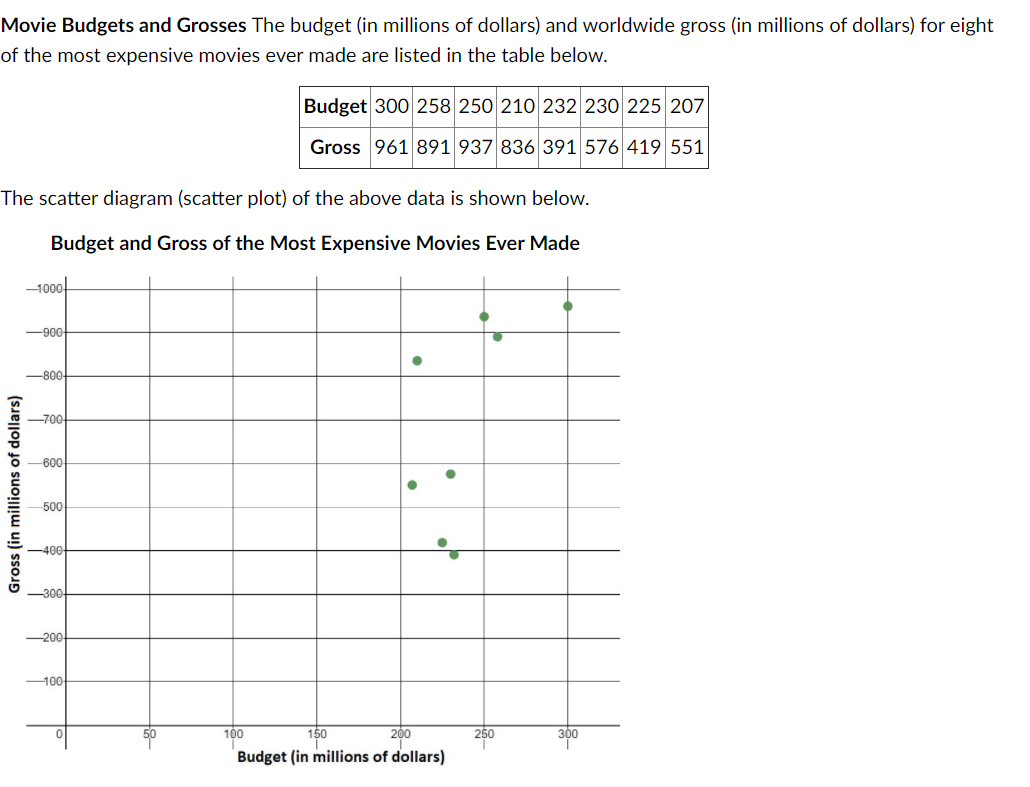

Transcribed Image Text:Movie Budgets and Grosses The budget (in millions of dollars) and worldwide gross (in millions of dollars) for eight
of the most expensive movies ever made are listed in the table below.
Budget 300 258 250 210 232 230 225 207
Gross 961 891 937 836 391 576 419 551
The scatter diagram (scatter plot) of the above data is shown below.
Budget and Gross of the Most Expensive Movies Ever Made
-1000-
-900
-800
-700
-600
500
400
-300-
-200-
100
100
150
200
250
300
Budget (in millions of dollars)
Gross (in millions of dollars)

Transcribed Image Text:1. Identify the variables as explanatory or response.
Gross (in millions of dollars): response
Budget (in millions of dollars): explanatory
2. What is the value of the sample correlation coefficient, r? Round to three decimals. r=
3. Identify the linear correlation by strength and type in that order.
Strength:
Туре:
Expert Solution
This question has been solved!
Explore an expertly crafted, step-by-step solution for a thorough understanding of key concepts.

This is a popular solution

Trending nowThis is a popular solution!

Step by stepSolved in 2 steps with 1 images

Knowledge Booster


Learn more about
Need a deep-dive on the concept behind this application? Look no further. Learn more about this topic, statistics and related others by exploring similar questions and additional content below.Similar questions
- Show work, thank you!arrow_forwardThe paired data below consist of the costs of advertising (in thousands of dollars) and the number of products sold (in thousands): Cost 9 Number 85 O 0.246 -0.071 0.235 0.708 2 52 3 55 Table 3 4 68 2 67 5 86 9 83 10 73arrow_forwardA high school has 44 players on the football team. The summary of the players' weights is given in the box plot. Approximately, what is the percentage of players weighing greater than or equal to 234 pounds? 166 203 234 154 256 - 0o 150 160 170 180 | 190 200 210 220 230 240 250 260 270 00 Weight (in pounds)arrow_forward
- Boats (tens of thousands) Manatees69 5467 3964 3571 4871 4472 6076 5482 6682 8086 7891 7993 9592 7293 7199 8198 93102 7294 9297 9592 8190 8690 8088 7187 68 Use the accompanying paired data consisting of registered boats (tens of thousands) and manatee fatalities from boat encounters. Let x represent the number of registered boats and let y represent the corresponding number of manatee deaths. Use the given number of registered boats and the given confidence level to construct a prediction interval estimate of manatee deaths. Use x=81(for 810,000registered boats) with a 99%confidence level. Use the chart above ___manatees<y< ___manateearrow_forwardResearchers wondered whether the size of a person's brain was related to the individual's mental capacity. They selected a sample of 5 females and 5 males and measured their MRI image pixel counts and IQ scores. Females Males MRI IQ MRI IG The data is reported to the right. Complete parts (a) through (d) below 139 858,472 140 955,003 935,494 924,059 1.079.550 1,001.121 Click the icon to view the critical values table. 991,305 138 141 857,782 833,868 790,619 133 135 132 141 135 140 AMRI 1,080,000- AIO 145 AIO 145- AMRI 1,080,000 780,000 130 130 780,000 130 780,000 780,000 130 1,080,000 145 1,080,000 MRI 145 MRI (b) Compute the linear correlation coefficient between MRI count and IQ. Are MRI count and IQ linearly related? Select the correct choice below and, if necessary, fill in the answer box to complete your choice. (Round to three decimal places as needed.) A. Yes, MRI count and IQ are linearly related since the linear correlation coefficient is O B. No. MRI count and IQ are not…arrow_forwardSmall Sample Size The dataset imagpop contains information about 10000 people from an imaginary population. One of the variables is math, which indicates whether the individual was a mathematics major. You can see the distribution of math majors in the population in the row percents shown below: rowPerc(xtabs(~math,data=imagpop)) ## no yes Total## 95.37 4.63 100.00 Suppose you were interested in the following Research Question: Are quantitative skills an important part of your job? You decide to quickly take a simple random sample of size 10 from this population. You can see the distribution of math majors in the sample below: set.seed(2014)smallsamp<-popsamp(n=10,pop=imagpop)rowPerc(xtabs(~math,data=smallsamp)) ## no yes Total## 100 0 100 Which of the following statements best describes a problem that may arise in this scenario? Group of answer choices ( ) The sampled individuals that were selected might all have jobs that require quantitative skills. This…arrow_forward
- Quiz Module 1 The stem-and-leaf plot shows house sale prices over the last week in Tacoma. The stem is in hundres of thousands of dollars the leaf is in tens of thousands of dollars. What is the price of the most expensive house sold? 0|6677789991|024477788899992|00112344456678893|00011224arrow_forwardTornadoes The following data represent the width (inyards) and length (in miles) of tornadoes.Width (yards), w Length (miles), L200 2.5350 4.8180 2.0300 2.5500 5.8400 4.5500 8.0800 8.0100 3.450 0.5700 9.0600 5.7Source: NOAA(a) Draw a scatter diagram of the data, treating width as theindependent variable.(b) What type of relation appears to exist between the widthand the length of tornadoes?(c) Select two points and find a linear model that containsthe points.(d) Graph the line on the scatter diagram drawn in part (b).(e) Use the linear model to predict the length of a tornadothat has a width of 450 yards.(f) Interpret the slope of the line found in part (c).arrow_forwardWatch the cell division video(https://www.youtube.com/watch?v=KIpcCyuypzg) Fill out the data table.arrow_forward
arrow_back_ios
arrow_forward_ios
Recommended textbooks for you
- MATLAB: An Introduction with ApplicationsStatisticsISBN:9781119256830Author:Amos GilatPublisher:John Wiley & Sons Inc
 Probability and Statistics for Engineering and th...StatisticsISBN:9781305251809Author:Jay L. DevorePublisher:Cengage Learning
 Statistics for The Behavioral Sciences (MindTap C...StatisticsISBN:9781305504912Author:Frederick J Gravetter, Larry B. WallnauPublisher:Cengage Learning
  Elementary Statistics: Picturing the World (7th E...StatisticsISBN:9780134683416Author:Ron Larson, Betsy FarberPublisher:PEARSON
 The Basic Practice of StatisticsStatisticsISBN:9781319042578Author:David S. Moore, William I. Notz, Michael A. FlignerPublisher:W. H. Freeman
 Introduction to the Practice of StatisticsStatisticsISBN:9781319013387Author:David S. Moore, George P. McCabe, Bruce A. CraigPublisher:W. H. Freeman
MATLAB: An Introduction with Applications
Statistics
ISBN:9781119256830
Author:Amos Gilat
Publisher:John Wiley & Sons Inc
Probability and Statistics for Engineering and th...
Statistics
ISBN:9781305251809
Author:Jay L. Devore
Publisher:Cengage Learning
Statistics for The Behavioral Sciences (MindTap C...
Statistics
ISBN:9781305504912
Author:Frederick J Gravetter, Larry B. Wallnau
Publisher:Cengage Learning
Elementary Statistics: Picturing the World (7th E...
Statistics
ISBN:9780134683416
Author:Ron Larson, Betsy Farber
Publisher:PEARSON
The Basic Practice of Statistics
Statistics
ISBN:9781319042578
Author:David S. Moore, William I. Notz, Michael A. Fligner
Publisher:W. H. Freeman
Introduction to the Practice of Statistics
Statistics
ISBN:9781319013387
Author:David S. Moore, George P. McCabe, Bruce A. Craig
Publisher:W. H. Freeman