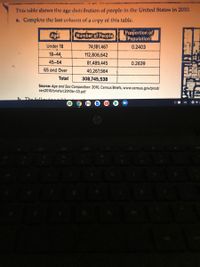
This table shows the age distribution of people in the United States in 2010. a. Complete the last column of a copy of this table. Proportion of Population Age Number of People Under 18 74,181,467 0.2403 18-44 112,806,642 45-64 81,489,445 0.2639 65 and Over 40,267,984 Total 308,745,538
Q: The list below shows the ages (in years) of 7 people riding in a van to a math competition.…
A: From the provided information,The data values are as follow:ages 15 12 9 15 14 40 46Sample size (n)…
Q: The following items represent the number of birds observed at a given feeder over the past several…
A:
Q: Match the appropriate boxplot to each histogram. Height distribution-U.S. adults of age 18-20 Answer…
A: The histograms and boxplots are given.
Q: f. Use your completed chart. What percent of the total number of vehicles over the 6-month period…
A: d. Average monthly number of vehicles entering grand canyon over six months Average=(total number of…
Q: scores of 40 students are listed below. Find P85. 30 35 43 44 47 48 54 55 56 57 59 62 63 65 66…
A: Given that Arranging Observations in the ascending order, We get…
Q: The following items represent the number of birds observed at a given feeder over the past several…
A: Given observations are: 32, 21, 85, 54, 4, 95, 45. The sample size is n=7.
Q: The data below shows car model and the color of vehicles sold at a Car dealership. Hyundai 20 Honda…
A: Solution: The table of car model and the color of the vehicles sold at a car dealership is given.
Q: The following tables gives the ages and blood pressure of 10 women: Age in 56 42 36 47 49 42 72 63…
A: Given that, The data on ages and blood pressure of 10 women.
Q: display the proportion of observations of each class relative to the total number of observations.…
A: It is given that the blank space statement. Here, need to find out the correct choice to fill the…
Q: Which box plot most resembles the information above? 0 34 45 0 24 34 0 + 18 H 24 25 53 54 =100 =100…
A: Assume the following box plot. The first and third vertical lines within the box represent (i.e.,…
Q: Data was collected for 300 fish from the North Atlantic. The length of the fish (in mm) is…
A: The 5th class is: [88.5, 90.5]
Q: The amount of monthly data usage by a sample of 10 cellphone User 2.1, 2.9, 7.3, 3.5 GB, 2.3, 1.8,…
A: Given information: The data for the monthly data usage for 10 cell phone users are given.
Q: As part of the National Health and Nutrition Examination Survey, the Department of Health and Human…
A: State the hypotheses. That is, there is no difference between the the reported height vs. the…
Q: Which data would be most suitable for a pie chart? A. A corporation's sales revenue for the last 5…
A: According to measurement, statistics, data can be classified in two types, such as quantitative data…
Q: 180 people are asked how many siblings they have? # of Siblings Frequency Relative Frequency…
A: The total number of people is 180.
Q: The following items represent the number of birds observed at a given feeder over the past several…
A: From the provided information, The number of observations (n) = 8
Q: Part 2 of 4 Compute the P-value. Round the answer to four decimal places. P-value = %3D
A: Use Ti calculator to find the P-value as follows: Select STAT > Edit > Enter the values of…
Q: (1) With 95% confidence, find the average cost of flying a commercial flight using Boeing 737s…
A: The data is entered in R software, linear model is fit for the data then the confidence interval for…
Q: A sample of 11 students are welghed and ranked according to their weight. Th median welght is the *…
A: Formula : 7th decile = (7(n+1)/10) th value of the observation
Q: We take the weights of five watermelons and get 12, 8, 14, 16, 17, and 11 pounds. What should we use…
A:
Q: Defined as the proportion of persons who are unaffected at the beginning of a study period. A. RATE…
A: Answer and explanation is given below.
Q: Given the following data, what score gives the lower 40%? 86, 70, 73, 82, 79, 76, 69, 78, 87,…
A: Data 86, 70, 73, 82, 79, 76, 69, 78, 87, 73, 66, 77
Q: Refer to the table1: the cumulative relative frequency for the class 30-39 is? A. 1.00 B. 0.25 C.…
A: It is an important part of statistics . It is widely used .
Q: Which data is most suitable for a pie chart? A. A corporation's sales revenue for the last 5 years…
A: According to measurement, statistics, data can be classified in two types, such as quantitative data…
Q: Given the following data, find the age that represents the 71st percentile. Ages of Presidents 56…
A: We have given the following data for ages of presidents: 564467476162664342465843595767
Q: Describe what you see in the attached scatterplot for a sample of 20 low birth weight infants.
A: Use the Excel and Calculate the Correlation Followings are the Steps to Calculate Correlation 1)…
Q: Based on the given info in the picture, determine the ff: • range score • average/mean score •…
A: From given stem and leaf the data set…
Q: Use the table above to calculate the ratio of seniors 65 and over to the total population in New…
A:
Q: 4- A florist is interested in the proportion of her clients that prefer roses in their flower…
A: In statistics, a population is a set of similar items or events which is of interest for some…
Q: instructions: Use technology to find statistical measuresRound to the nearest hundredth. Data Set :…
A: Given data is54, 88, 49, 44, 96, 72, 46, 58, 79,92, 44, 50, 102, 80, 72, 66, 64, 61,60, 56, 48, 52,…
Q: 2 students in a statistics class are categorized by gender and by the year in school. The numbers…
A: Given, 9.) Gender freshman sophomore junior senior Graduate Total Male 1 2 9 17 2 31 Female…
Q: following the past several days. What is the median number of birds to visit that feeder? 6, 97, 4,…
A: We have given that, The data set are :- 6, 97, 4, 40, 20, 45, 37, 48 Then, We will find the…
Q: The information below gives the amount of Miranda's electric bill for each month in the past year.…
A: To find the median: Arrange the data points from smallest to largest. If the number of data points…
Q: 50 part-time students were asked how many courses they were taking this term. The (incomplete)…
A: The following table is given. Number of courses Frequency Relative frequency Cumulative frequency…
Q: A national survey of graduate students is conducted to assess their consumption of coffee. The…
A:
Q: In a newspaper or magazine of your choice, find a statistical study that contains an estimated…
A: A population proportion is a fraction of the population that has a certain characteristic. Consider…
Q: (e) Percentage of viewers who are 35 to 54 or prefer videos on a mobile or laptop device. Percentage…
A: Percentage is a ratio expressed as a fraction of 100. The percentage is denoted by the symbol %. The…
Q: Pie charts and bar charts are used to display frequency data from A. Qualitative variables B.…
A: Pie charts and bar charts are used to display frequency data from
Q: A study dealing with health care issues plans to take a sample survey of 1500 Americans to estimaté…
A: Parameter: The statistical measure that describes the features of the population is termed as a…
Q: The following items represent the number of birds observed at a given feeder over the past several…
A: Calculate Median from the following data99,37,21,12,75,58,2
Q: The table (attached image) gives measurements of length and weight for a sample of 20 low birth…
A: Histogram is the visual representation of continuous data.
Q: 5. Tabular form of data presentation is also termed as A. Frequency distribution B. Tabular table.…
A: Solution
Q: Use the provided histogram to answer questions about the number of births for each age group. 1.…
A: Frequency: The frequency is the number of observations in a data set. Percentage: A percentage is…
Q: Athletes' heart rates were recorded after doing one minute of jumping jacks. The results were…
A: There are multiple unrelated questions. As per Bartelby guidlines, only 1 question will be solved…
Q: Use the same scales to construct boxplots for the pulse rates of males and females from the…
A: Boxplot for men's is (C) Boxplot for women's is (A)
Q: low are the ages of 40 people. Draw the frequency chart and histogram chart. 34, 67, 40, 72, 37,…
A: The frequency chart is as follows:
Q: 12) The calculated value of the test statistic equals: a) 3.11 b) -3.11 c) -2.60 d) 2.60 e) 1.02 f)…
A: It is given that n1 = 200 n2 = 150 Favourable cases, X1 = 22 Favourable cases, X2 = 23
Q: Looking at the histogram for the data, what is the height (frequency) of the 4th bar on the…
A: Solution-: From the given data we draw the histogram and find the height (Frequency) of the 4th bar…
Trending now
This is a popular solution!
Step by step
Solved in 2 steps with 1 images
- The ages of the members of a legislature from a particular state are listed below. Find the mean, median, and mode of the data set, if possible. If any measure cannot be found or does not represent the center of the data, explain why. 65 44 37 46 52 46 34 55 49 O Find the median age. Select the correct choice below and, if necessary, fill in the answer box to complete your choice. O A. The median age is (Round to one decimal place as needed.) O B. There is no median age. Does the median represent the center of the data? O A. The median represents the center. O B. The median does not represent the center because it is the largest data value. O C. The median does not represent the center because it is not a data value. O D. The median does not represent the center because it is the smallest data value. O E. There is no median age. Find the mode of the ages. Select the correct choice below and, if necessary, fill in the answer box to complete your choice.Below is a sample of 21 diastolic blood pressure readings. Data: 104, 88, 93, 51, 56, 70, 68, 84, 78, 67, 88, 93, 96, 80, 80, 75, 78, 85, 88, 80, 82 a. What is the class width if you use 5 classes to create a frequency table? b. What is the mean? Round your answer to two decimal places. c. What is the median? d. What is the range? e. What is Q1? f. What is Q3?Indicate the level of the measurement of the data in the table below. Write down the number of the question with the correct answer. Religious affiliationThe number of sit-ups you can doNumber of traffic fatalitiesTime required to complete a crossword puzzle The ages of the students in your study groupThe colours you can identify in a rainbowTelephone numbers in a telephone directoryShoe sizesThe three major professional tennis tournaments The classification of Boeing aircraft as 727, 737 or 747, according to size
- A veterinarian recorded how many kittens were born in each litter. This data is summarized in the histogram below. (Note: The last class actually represents "7 or more kittens," not just 7 kittens.) QUESTIONL: What is the frequency of the litter having at most 2 kittens? (PHOTO ATTACHED)Based on your collected data on the survey of assignment 1 fill the following table and then answer the questions below. Age (Years) Male Female Less than 21 years 1 6. Between or equal 21 and 24 years More than 24 years 2Referto the table below: Weight (in kg) 40-44 45-49 50-54 55-59 60-64 65-69 70-74 75-79 The value of N is Answer: — I Frequency 1 14 15 21 14 10 4 1
- Researchers wondered whether the size of a person's brain was related to the individual's mental capacity. They selected a sample of 5 females and 5 males and measured their MRI image pixel counts and IQ scores. Females Males MRI IQ MRI IG The data is reported to the right. Complete parts (a) through (d) below 139 858,472 140 955,003 935,494 924,059 1.079.550 1,001.121 Click the icon to view the critical values table. 991,305 138 141 857,782 833,868 790,619 133 135 132 141 135 140 AMRI 1,080,000- AIO 145 AIO 145- AMRI 1,080,000 780,000 130 130 780,000 130 780,000 780,000 130 1,080,000 145 1,080,000 MRI 145 MRI (b) Compute the linear correlation coefficient between MRI count and IQ. Are MRI count and IQ linearly related? Select the correct choice below and, if necessary, fill in the answer box to complete your choice. (Round to three decimal places as needed.) A. Yes, MRI count and IQ are linearly related since the linear correlation coefficient is O B. No. MRI count and IQ are not…mg Calcium is essential to tree growth. In 1990, the concentration of calcium in precipitation in a certain area was 0.12 milligrams per liter A random sample of 10 precipitation dates in 2018 results in the following data table. Complete parts (a) through (c) below. (a) State the hypotheses for determining if the mean concentration of calcium precipitation has changed since 1990. Ho: V0.12 mg/L H,: V0.12 mg/L mg mg (b) With 99% confidence, the mean concentration of calcium in precipitation in this area in 2018 is between and (Use ascending order. Round to four decimal places as needed.) (c) Does the sample evidence suggest that calcium concentrations have changed since 1990? mg O A. No, because the confidence interval contains 0.12 mg O B. No, because the confidence interval does not contain 0.12 O C. Yes, because the confidence interval does not contain 0.12 mg O D. Yes, because the confidence interval contains 0.12 LThe weekly salaries (in dollars) for the workers in a local paper factory are listed below. Find the median and mode of the salaries. 614, 607, 712, 607, 752, 655, 620, 681, 730, 650, 607, 710, 655, 620 ..... The median salary is $. (Type an integer or a decimal.) Select the correct choice below and, if necessary, fill in the answer box to complete your choice. Q 5 O A. The mode of the salaries is $ (Type an integer or a decimal. Use a comma to separate answers as needed.) B. There is no mode.
- Provide a brief description to the histogram belowCreate a Frequency Distribution Table using the data provided: 46, 62, 38, 28, 57, 71, 63, 75, 60, 74, 82, 77, 80, 94, 89 The FDT should include 1. classes with the lower and upper limits 2. class boundaries 3. tally 4. frequencies 5. class marks 6. cumulative frequencyOne of the biggest factors in determining the value of a home is the square footage. The accompanying data represent the square footage and selling price (in thousands of dollars) for a random sample of homes for sale in a certain region. Complete parts (a) through (h) below. A Click the icon to view the housing data. (a) Which variable is the explanatory variable? Question Help v O Square Footage O Selling Price (b) Draw a scatter diagram of the data. Choose the correct scatter diagram below. O A. 4500- OB. 750 Oc. OD. 750- 1000- 150 1000 Click to select your answer(s) 4500 P Type here to search ON&E EB WA 421 PM 914 Panasonic CF-54 TOUGHBOOK 図 CDSS-4853 SarolPause Lock Break A/C F8 F9 F10 F11 F12 PrtSc Num Lock F2 F3 F4 F5 F6 F7 Esc SysRa Back space & Home 2$ 4 @ %23 1 A1 2 AZ 3 5 Page Y U R Q W 15 Tab Enter K 2 F H. 3 i田