MATLAB: An Introduction with Applications
6th Edition
ISBN: 9781119256830
Author: Amos Gilat
Publisher: John Wiley & Sons Inc
expand_more
expand_more
format_list_bulleted
Concept explainers
Topic Video
Question
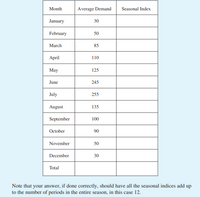
Given the following average demand for each month, calculate the seasonal indices
for each month.

Transcribed Image Text:Month
Average Demand
Seasonal Index
January
30
February
50
March
85
April
110
May
125
June
245
July
255
August
135
September
100
October
90
November
50
December
30
Total
Note that your answer, if done correctly, should have all the seasonal indices add up
to the number of periods in the entire season, in this case 12.

Transcribed Image Text:1%
1%
4%
15%
30%
30%
15%
4%
-2
-1
2
3
MEAN ABSOLUTE DEVIATIONS
FIGURE 8.12 Normal distribution curve.
Expert Solution
This question has been solved!
Explore an expertly crafted, step-by-step solution for a thorough understanding of key concepts.
This is a popular solution
Trending nowThis is a popular solution!
Step by stepSolved in 3 steps

Knowledge Booster
Learn more about
Need a deep-dive on the concept behind this application? Look no further. Learn more about this topic, statistics and related others by exploring similar questions and additional content below.Similar questions
- If actual period demand varies from the forecast by more than 3MAD, this indicates: there is 3% chance that the forecast is wrong. there is a 98% chance that the forecast is wrong. there is a 97% chance that the forecast is wrong. there is a 3% chance that the forecast is correct Moving to the next question prevents changes to this answer:arrow_forwardComplete the following table and draw a graph showing how bond price for each bond changes over time as they move towards their maturity dates. Describe the relationship between bond prices and time remaining for maturity. Using the table below show all the calculations for every bond prices calculated Years remaining to maturity BOND A Coupon rate = 8% p.a. Market interest rate = 6% p.a. BOND B Coupon rate = 6% p.a. Market interest rate = 6% p.a. BOND C Coupon rate = 4% p.a. Market interest rate = 6% p.a. 10 9 8 7 6 5 4 3 2 1 0arrow_forwardBelow is a table containing data on product demand for the most recent three months along with the forecasts that had been made for those three previous months. Calculate the MAPE. Month Demand Forecast 1 308 310 388 390 344 342 2.arrow_forward
- Suppose that a firm's sales were $3,750,000 five years ago and are $5,250,000 today. What was the geometric mean growth rate in sales over the past five years?arrow_forwardBelow is a table containing data on product demand for the most recent five months along with the forecasts that had been made for those 5 previous months. Use the exponential smoothing method to forecast the number of sales to expect next month. Use the following value of alpha: 0.2. Month Demand Forecast 1 308 349.2 2 388 340.9 3 344 350.3 4 400 349.1 5 341 359.3arrow_forwardThe rent for tenants in a building in 1940 was $30 per month. The landlord changes the rent based on the CPI-U. Use the CPI-U chart below to calculate the current rent in 2019. Round to the nearest dollar. Year CPI-U 1940 14.0 1949 23.8 1983 99.6 2000 172.2 2005 195.3 2009 214.5 2014 236.0 2017 245.1 2019 255.7 2020 258.8arrow_forward
arrow_back_ios
arrow_forward_ios
Recommended textbooks for you
 MATLAB: An Introduction with ApplicationsStatisticsISBN:9781119256830Author:Amos GilatPublisher:John Wiley & Sons Inc
 Probability and Statistics for Engineering and th...StatisticsISBN:9781305251809Author:Jay L. DevorePublisher:Cengage Learning
 Statistics for The Behavioral Sciences (MindTap C...StatisticsISBN:9781305504912Author:Frederick J Gravetter, Larry B. WallnauPublisher:Cengage Learning
 Elementary Statistics: Picturing the World (7th E...StatisticsISBN:9780134683416Author:Ron Larson, Betsy FarberPublisher:PEARSON
 The Basic Practice of StatisticsStatisticsISBN:9781319042578Author:David S. Moore, William I. Notz, Michael A. FlignerPublisher:W. H. Freeman
 Introduction to the Practice of StatisticsStatisticsISBN:9781319013387Author:David S. Moore, George P. McCabe, Bruce A. CraigPublisher:W. H. Freeman

MATLAB: An Introduction with Applications
Statistics
ISBN:9781119256830
Author:Amos Gilat
Publisher:John Wiley & Sons Inc

Probability and Statistics for Engineering and th...
Statistics
ISBN:9781305251809
Author:Jay L. Devore
Publisher:Cengage Learning

Statistics for The Behavioral Sciences (MindTap C...
Statistics
ISBN:9781305504912
Author:Frederick J Gravetter, Larry B. Wallnau
Publisher:Cengage Learning

Elementary Statistics: Picturing the World (7th E...
Statistics
ISBN:9780134683416
Author:Ron Larson, Betsy Farber
Publisher:PEARSON

The Basic Practice of Statistics
Statistics
ISBN:9781319042578
Author:David S. Moore, William I. Notz, Michael A. Fligner
Publisher:W. H. Freeman

Introduction to the Practice of Statistics
Statistics
ISBN:9781319013387
Author:David S. Moore, George P. McCabe, Bruce A. Craig
Publisher:W. H. Freeman