
MATLAB: An Introduction with Applications
6th Edition
ISBN: 9781119256830
Author: Amos Gilat
Publisher: John Wiley & Sons Inc
expand_more
expand_more
format_list_bulleted
Related questions
Question
Given the following data for demand at the XYZ Company, calculate the monthly forecast for 2003 using a 3-month moving average. Calculate the Forecast, Error, MAD (
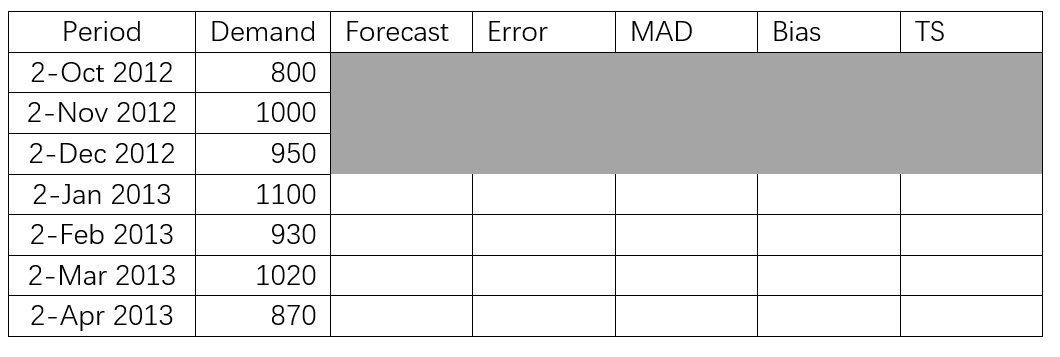

Transcribed Image Text:Period
Demand
Forecast
Error
MAD
Bias
TS
2-Oct 2012
800
2-Nov 2012
1000
2-Dec 2012
950
2-Jan 2013
1100
2-Feb 2013
930
2-Mar 2013
1020
2-Apr 2013
870
Expert Solution
This question has been solved!
Explore an expertly crafted, step-by-step solution for a thorough understanding of key concepts.

This is a popular solution

Trending nowThis is a popular solution!

Step by stepSolved in 2 steps

Knowledge Booster

Similar questions
- please answer within 30 minutes.arrow_forwardSuppose seafood price and quantity data for the years 2000 and 2009 follow. Use 2000 as the base period. 2000 2000 Price ($/lb) 2009 Seafood Qty. (Ib) Price ($/lb) Halibut 75,090 2.01 2.33 Lobster 83,180 3.62 3.09 Tuna 50,779 1.87 1.97 (a) Compute a price relative for each type of seafood. (Round your answers to one decimal place.) Seafood Price Relative Halibut Lobster Tuna (b) Compute a weighted aggregate price index for the seafood catch. (Round your answer to one decimal place.) I 2009 - Comment on the change in seafood prices over the nine-year period. (Enter your percentage as a positive value. Round your answer to one decimal place.) Seafood prices have --Select--- v by % over the 9-year period according to the index.arrow_forwardMonth Actual demand Forecasted Demand 1 950 1000 2 1070 1000 3 1100 1000 4 960 1000 5 1090 1000 6 1050 1000 For the dataset above, compute the overall MAPE.arrow_forward
arrow_back_ios
arrow_forward_ios
Recommended textbooks for you
- MATLAB: An Introduction with ApplicationsStatisticsISBN:9781119256830Author:Amos GilatPublisher:John Wiley & Sons Inc
 Probability and Statistics for Engineering and th...StatisticsISBN:9781305251809Author:Jay L. DevorePublisher:Cengage Learning
 Statistics for The Behavioral Sciences (MindTap C...StatisticsISBN:9781305504912Author:Frederick J Gravetter, Larry B. WallnauPublisher:Cengage Learning
  Elementary Statistics: Picturing the World (7th E...StatisticsISBN:9780134683416Author:Ron Larson, Betsy FarberPublisher:PEARSON
 The Basic Practice of StatisticsStatisticsISBN:9781319042578Author:David S. Moore, William I. Notz, Michael A. FlignerPublisher:W. H. Freeman
 Introduction to the Practice of StatisticsStatisticsISBN:9781319013387Author:David S. Moore, George P. McCabe, Bruce A. CraigPublisher:W. H. Freeman
MATLAB: An Introduction with Applications
Statistics
ISBN:9781119256830
Author:Amos Gilat
Publisher:John Wiley & Sons Inc
Probability and Statistics for Engineering and th...
Statistics
ISBN:9781305251809
Author:Jay L. Devore
Publisher:Cengage Learning
Statistics for The Behavioral Sciences (MindTap C...
Statistics
ISBN:9781305504912
Author:Frederick J Gravetter, Larry B. Wallnau
Publisher:Cengage Learning
Elementary Statistics: Picturing the World (7th E...
Statistics
ISBN:9780134683416
Author:Ron Larson, Betsy Farber
Publisher:PEARSON
The Basic Practice of Statistics
Statistics
ISBN:9781319042578
Author:David S. Moore, William I. Notz, Michael A. Fligner
Publisher:W. H. Freeman
Introduction to the Practice of Statistics
Statistics
ISBN:9781319013387
Author:David S. Moore, George P. McCabe, Bruce A. Craig
Publisher:W. H. Freeman