MATLAB: An Introduction with Applications
6th Edition
ISBN: 9781119256830
Author: Amos Gilat
Publisher: John Wiley & Sons Inc
expand_more
expand_more
format_list_bulleted
Question

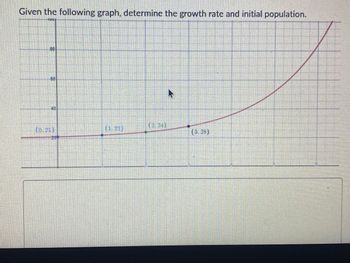
Transcribed Image Text:Given the following graph, determine the growth rate and initial population.
80
180
(0.21)
20
(3.28)
Expert Solution
This question has been solved!
Explore an expertly crafted, step-by-step solution for a thorough understanding of key concepts.
Step by stepSolved in 3 steps with 13 images

Knowledge Booster
Similar questions
- b. Water that is initially contaminated with a concentration of 9 milligrams of pollutant per liter of water is subjected to a cleaning process. The cleaning process is able to reduce the pollutant concentration by 25% every 2 hours. Let C(t) = 9 be the concentration, in milligrams of pollutant per liter of water t hours after the purification process begins. Find the concentration of pollutant in the water after 5 hours. Please round your answer to two decimal places. A) 2.14 mg/1 B) 4.38 mg/l C) 0.0088 mg/l D) 0.28 mg/larrow_forwardThe number of passengers using a rail link fell from 190205 to174989. Find the percentage decrease Select one: O a. 0.08% O b. 80% O c. 90% O d. 92% O e. None of the abovearrow_forward112. y = f(x) 14 2. 3-2-1 1 2 %24arrow_forward
- An article reports "attendance dropped 7% this year, to 1700." What was the attendance before the drop?_________ people Round to the nearest whole person.arrow_forward15. Solve. 200(1.07)2€ = 800 %3Darrow_forwardThe table below shows an index based in 2010 (2010 = 100). Year 2011 2012 2013 2014 Index 100.4 104.8 105.9 108.8 The base year is changed to 2012. Find the index for 2011 based on 2012. Give your answer in 1 d.p.arrow_forward
- 2. a. Write an exponential equation of the form y = a(b)* that passes through the points (1, 6.4) and (4, 3.2768). Explain how you got your answer OR show your work. b. Identify the percent change that is modeled by your equation in part a. In other words, identify whether your equation represents a percent increase or decrease AND how much is that percent increase or decrease.arrow_forwardComplete the table shown to the right for the population growth model for a certain country. 2006 Population (millions) 46.2 Projected 2017 Population (millions) 38.8 Projected Growth Rate, k Be sure to show your work.arrow_forward
arrow_back_ios
arrow_forward_ios
Recommended textbooks for you
 MATLAB: An Introduction with ApplicationsStatisticsISBN:9781119256830Author:Amos GilatPublisher:John Wiley & Sons Inc
 Probability and Statistics for Engineering and th...StatisticsISBN:9781305251809Author:Jay L. DevorePublisher:Cengage Learning
 Statistics for The Behavioral Sciences (MindTap C...StatisticsISBN:9781305504912Author:Frederick J Gravetter, Larry B. WallnauPublisher:Cengage Learning
 Elementary Statistics: Picturing the World (7th E...StatisticsISBN:9780134683416Author:Ron Larson, Betsy FarberPublisher:PEARSON
 The Basic Practice of StatisticsStatisticsISBN:9781319042578Author:David S. Moore, William I. Notz, Michael A. FlignerPublisher:W. H. Freeman
 Introduction to the Practice of StatisticsStatisticsISBN:9781319013387Author:David S. Moore, George P. McCabe, Bruce A. CraigPublisher:W. H. Freeman

MATLAB: An Introduction with Applications
Statistics
ISBN:9781119256830
Author:Amos Gilat
Publisher:John Wiley & Sons Inc

Probability and Statistics for Engineering and th...
Statistics
ISBN:9781305251809
Author:Jay L. Devore
Publisher:Cengage Learning

Statistics for The Behavioral Sciences (MindTap C...
Statistics
ISBN:9781305504912
Author:Frederick J Gravetter, Larry B. Wallnau
Publisher:Cengage Learning

Elementary Statistics: Picturing the World (7th E...
Statistics
ISBN:9780134683416
Author:Ron Larson, Betsy Farber
Publisher:PEARSON

The Basic Practice of Statistics
Statistics
ISBN:9781319042578
Author:David S. Moore, William I. Notz, Michael A. Fligner
Publisher:W. H. Freeman

Introduction to the Practice of Statistics
Statistics
ISBN:9781319013387
Author:David S. Moore, George P. McCabe, Bruce A. Craig
Publisher:W. H. Freeman