
MATLAB: An Introduction with Applications
6th Edition
ISBN: 9781119256830
Author: Amos Gilat
Publisher: John Wiley & Sons Inc
expand_more
expand_more
format_list_bulleted
Related questions
Question
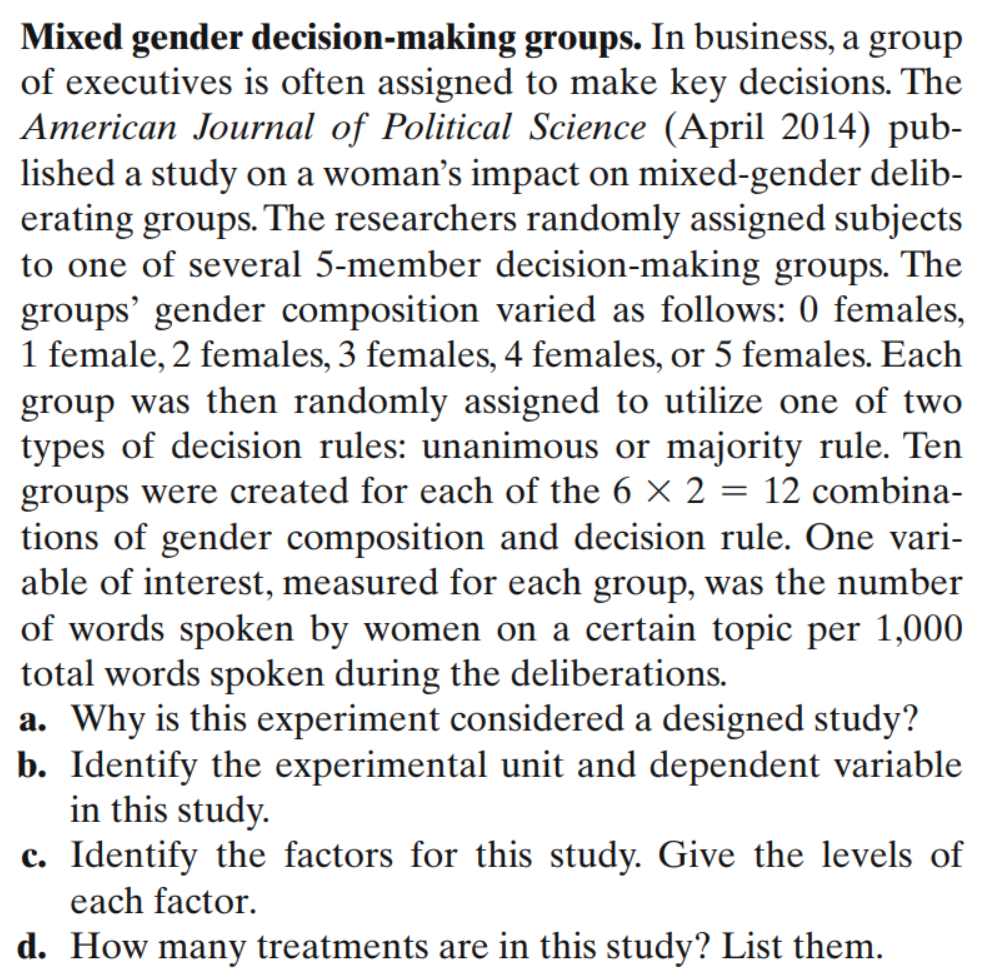

Transcribed Image Text:Mixed gender decision-making groups. In business, a group
of executives is often assigned to make key decisions. The
American Journal of Political Science (April 2014) pub-
lished a study on a woman's impact on mixed-gender delib-
erating groups. The researchers randomly assigned subjects
to one of several 5-member decision-making groups. The
groups' gender composition varied as follows: 0 females,
1 female, 2 females, 3 females, 4 females, or 5 females. Each
group was then randomly assigned to utilize one of two
types of decision rules: unanimous or majority rule. Ten
groups were created for each of the 6 × 2 = 12 combina-
tions of gender composition and decision rule. One vari-
able of interest, measured for each group, was the number
of words spoken by women on a certain topic per 1,000
total words spoken during the deliberations.
a. Why is this experiment considered a designed study?
b. Identify the experimental unit and dependent variable
in this study.
c. Identify the factors for this study. Give the levels of
each factor.
d. How many treatments are in this study? List them.
Expert Solution
This question has been solved!
Explore an expertly crafted, step-by-step solution for a thorough understanding of key concepts.

This is a popular solution

Trending nowThis is a popular solution!

Step by stepSolved in 2 steps

Knowledge Booster

Similar questions
- Deforestation is a serious problem throughout much of India. An article discusses the social forces that influence forest management policies in three Indian states: Haryana, Bihar, and Uttar Pradesh. The forest quality in Haryana is somewhat degraded, in Bihar it is very degraded, and in Uttar Pradesh it is well-stocked. In order to study the relationship between educational levels and attitudes toward forest management, random samples of adults in each of these states were surveyed and their educational levels were ascertained. The numbers of adults at each of several educational levels were recorded. The data are presented in the following table (see image). A.Find the P-value B.State a conclusion. Can you conclude that the educational levels differ among the three states?arrow_forwardMike Jimenez is president of the teachers’ union for Preston School District. In preparing for upcoming negotiations, he would like to investigate the salary structure of classroom teachers in the district. He believes there are three factors that affect a teacher’s salary: years of experience, a rating of teaching effectiveness given by the principal, and whether the teacher has a master’s degree (0 = No, 1 = Yes). A random sample of 20 teachers resulted in the following data. Salary ($ Thousands) Years of Experience Principal's Rating Master's Degree 51.1 8 95 0 43.6 5 84 0 39.3 2 100 1 53 15 51 1 48.6 11 53 0 55 14 81 1 52 9 85 0 46.8 7 52 1 58.6 22 68 1 41.7 3 97 1 35.7 1 83 0 40.6 5 71 0 61.8 23 77 1 46.7 17 61 0 48.4 12 83 1 43.6 14 71 0 51.8 8 59 1 40.7 4 93 0 42.8 2 58 1 42.9 8 90 0 g. What does the value of the Coefficient of Determination tell you about the data? h. Run a diagnosis to deterime if the model is…arrow_forwardA study was conducted to explore the prevalence and impact of sleep problems on various aspects of people's lives. Staff from a university in Melbourne, Australia were invited to complete a questionnaire containing questions about their sleep behaviour (e.g. hours slept per night), sleep problems (e.g. difficulty getting to sleep) and the impact that these problems have on aspects of their lives (work, driving, relationships). The sample consisted of 271 respondents (55% female, 45% male) ranging in age from 18 to 84 years (M=43.9yrs). A student researcher is interested in examining whether the participants in the study sleep for 8 hours a night, the recommended average for adults. Proposed analysis and why you chose the analysis? Measurement type (i.e., nominal, ordinal, continuous) for variable(s) that will be used in the analysis? Null and alternative hypotheses (based on context of study) in symbols? id sex age weight height sleep 83 0 42 52 162 9…arrow_forward
- For the following questions, THERE IS NO NEED FOR EXPLANATION. PLEASE PROVIDE JUST THE ANSWER THANK YOU. Please DO NOT waste time on writing things to explain. Please answer in 30 mintues or else I will write a bad review. If you follow my rules and answer in less than 30 mintues then I will write a very long and wonderful review about you. ANSWER the questions correlty and please answer all the questions with what it regards in saying exactly.arrow_forwardMike Jimenez is president of the teachers’ union for Preston School District. In preparing for upcoming negotiations, he would like to investigate the salary structure of classroom teachers in the district. He believes there are three factors that affect a teacher’s salary: years of experience, a rating of teaching effectiveness given by the principal, and whether the teacher has a master’s degree (0 = No, 1 = Yes). A random sample of 20 teachers resulted in the following data. Salary ($ Thousands) Years of Experience Principal's Rating Master's Degree 51.1 8 95 0 43.6 5 84 0 39.3 2 100 1 53 15 51 1 48.6 11 53 0 55 14 81 1 52 9 85 0 46.8 7 52 1 58.6 22 68 1 41.7 3 97 1 35.7 1 83 0 40.6 5 71 0 61.8 23 77 1 46.7 17 61 0 48.4 12 83 1 43.6 14 71 0 51.8 8 59 1 40.7 4 93 0 42.8 2 58 1 42.9 8 90 0 a. What is the question being asked? b. Label your dependent variable: y = c. Label your independent variables: x1 = x2 = x3 = d.…arrow_forwardA study investigated the relationship between audit delay and variables that describe the client and the auditor. The file Audit contains data from a sample of 40 companies on the following set of variables: Delay: The length of time from a company's fiscal year-end to the date of the auditor's report. Industry: A dummy variable coded 1 if the firm was an industrial company or 0 if the firm was a bank, savings and loan, or insurance company. Public: A dummy variable coded 1 if the company was traded on an organized exchange or over the counter; otherwise coded 0. Quality: A measure of overall quality of internal controls, as judged by the auditor, on a five-point scale ranging from "virtually none" (1) to "excellent" (5). Finished: A measure ranging from 1 to 4, as judged by the auditor, where 1 indicates "all work performed subsequent to year-end" and indicates 4 "most work performed prior to year-end." Click on the datafile logo to reference the data. Consider a model in which…arrow_forward
- Bank of America's Consumer Spending Survey collected data on annual credit card charges in seven different categories of expenditures: transportation, groceries, dining out, household expenses, home furnishings, apparel, and entertainment (U.S. Airways Attache, December 2003). Using data from a sample of 42 credit card accounts, assume that each account was used to identify the annual credit card charges for groceries (population 1) and the annual credit card charges for dining out (population 2). Using the difference data, the sample mean difference was = $844, and the sample standard deviation was sd = $1,166. C) What is the point estimate of the difference between the population means? $ What is the 95% confidence interval estimate of the difference between the population means (to the nearest whole number)? ( need amount, need amount)arrow_forwardBelow is data from a study examining the effects of two different psychotherapy treatments on self-esteem. Specifically, two different treatment types (treat1 and treat2) were compared to a waiting list control group in terms of increasing self-esteem; the main question concerned whether each separate therapy type was different from no treatment at all. The values shown below are the self-esteem scores for the participants in each group (higher values indicate greater self-esteem). a. What are the null and alternative hypotheses? b. If there are differences between the groups, be specific with respect to which groups differarrow_forward2.- The journal Behavioral Research in Accounting published a study of Machiavellian traits in accountants. Machiavellian describes negative character traits that include manipulation, cunning, duplicity, deception, and bad faith. A questionnaire by email was administered to a random sample of 700 accounting alumni of a large southwestern university; however, due to nonresponse and incomplete answers, only 198 questionnaires could be analyzed. Several variables were measured, including age, gender, level of education, income, job satisfaction score, and Machiavellian (“Mach") rating score. The research findings suggest that Machiavellian behavior is not required to achieve success in the accounting profession. a) What is the populatidn of interest to the researcher? Answer: Business accountants in the southwest Accountants in general Accounting alumni from this university Business alumni from this university b) What inference was made by the researcher? Answer: Accountants are always…arrow_forward
- A warehouse manager wants to know if there is an association between the shift worked and being on time for work. To investigate, he selects a random sample of 70 workers and classifies each one according to the shift they worked most recently and whether they were on time for work. He was unable to classify a substantial number of people as being on time, so he classified those individuals as unknown. The data are displayed in the table. The manager would like to know if these data provide convincing evidence of an association between the shift worked and being on time in the large population of all workers at this warehouse. The random and 10% conditions are met. Is the Large Counts condition met? Yes, the smallest expected count is 5, so all expected counts are at least 5. Yes, the smallest expected count is 8.54, so all expected counts are at least 5. No, the smallest expected count is 2.56, so the expected counts are not all at least 5. No, the smallest expected count is…arrow_forwardThe Bureau of Transportation reports on-time performance for airlines at major airports. JetBlue, United, and US Airways share Terminal C and Boston's Logan Airport. The percentage of on-time flights reported for a sample month were 76.8% for JetBlue, 71.5% for United, and 82.2% for US Airways. Assume that 30% of the arriving flights at this terminal are JetBlue flights, 32% are United flights, and 38% are US Airways flights. a. Develop a contingency table (table of joint probabilities and marginal probabilities). b. An announcement is made that Flight 1382 will arrive at Terminal C. What is the probability that the flight will arrive on time? c. Flight 1382 arrives on time. What is the probability that Flight 1382 is operated by US Airways? d. Flight 1382 will not arrive on time. What is the probability that Flight 1382 is operated by United?arrow_forwardThe student population at the state college consists of 30% freshmen, 25% sophomores, 25% juniors, and 20% seniors. The college theater department recently staged a production of a modem musical. A researcher recorded the class status of each student entering the theater and found a total of 20 freshmen, 23 sophomores, 22 juniors, and 15 seniors. Is the distribution of class status for theatergoers significantly different from the distribution for the general college? Test at the .05 level of significance.arrow_forward
arrow_back_ios
SEE MORE QUESTIONS
arrow_forward_ios
Recommended textbooks for you
- MATLAB: An Introduction with ApplicationsStatisticsISBN:9781119256830Author:Amos GilatPublisher:John Wiley & Sons Inc
 Probability and Statistics for Engineering and th...StatisticsISBN:9781305251809Author:Jay L. DevorePublisher:Cengage Learning
 Statistics for The Behavioral Sciences (MindTap C...StatisticsISBN:9781305504912Author:Frederick J Gravetter, Larry B. WallnauPublisher:Cengage Learning
  Elementary Statistics: Picturing the World (7th E...StatisticsISBN:9780134683416Author:Ron Larson, Betsy FarberPublisher:PEARSON
 The Basic Practice of StatisticsStatisticsISBN:9781319042578Author:David S. Moore, William I. Notz, Michael A. FlignerPublisher:W. H. Freeman
 Introduction to the Practice of StatisticsStatisticsISBN:9781319013387Author:David S. Moore, George P. McCabe, Bruce A. CraigPublisher:W. H. Freeman
MATLAB: An Introduction with Applications
Statistics
ISBN:9781119256830
Author:Amos Gilat
Publisher:John Wiley & Sons Inc
Probability and Statistics for Engineering and th...
Statistics
ISBN:9781305251809
Author:Jay L. Devore
Publisher:Cengage Learning
Statistics for The Behavioral Sciences (MindTap C...
Statistics
ISBN:9781305504912
Author:Frederick J Gravetter, Larry B. Wallnau
Publisher:Cengage Learning
Elementary Statistics: Picturing the World (7th E...
Statistics
ISBN:9780134683416
Author:Ron Larson, Betsy Farber
Publisher:PEARSON
The Basic Practice of Statistics
Statistics
ISBN:9781319042578
Author:David S. Moore, William I. Notz, Michael A. Fligner
Publisher:W. H. Freeman
Introduction to the Practice of Statistics
Statistics
ISBN:9781319013387
Author:David S. Moore, George P. McCabe, Bruce A. Craig
Publisher:W. H. Freeman