FINANCIAL ACCOUNTING
10th Edition
ISBN: 9781259964947
Author: Libby
Publisher: MCG
expand_more
expand_more
format_list_bulleted
Question

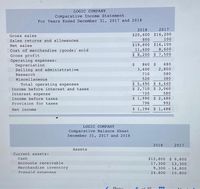
Transcribed Image Text:LOGIC COMPANY
Comparative Income Statement
For Years Ended December 31, 2017 and 2018
2018
2017
$20,600 $16,200
800
Gross sales
100
Sales returns and allowances
$19,800 $16,100
11,600
$ 8,200 $ 7,500
Net sales
8,600
Cost of merchandise (goods) sold
Gross profit
Operating expenses:
Depreciation
Selling and administrative
Research
$
3,400
860 $
680
2,800
710
580
Miscellaneous
520
380
$ 5,490 $ 4,440
$ 2,710 $ 3,060
Total operating expenses
Income before interest and taxes
Interest expense
720
580
$ 1,990 $ 2,480
796
Income before taxes
Provision for taxes
992
Net income
$ 1,194 $ 1,488
LOGIC COMPANY
Comparative Balance Sheet
December 31, 2017 and 2018
2018
2017
Assets
Current assets:
Cash
$12,800 $ 9,800
13,300
14,800
10.800
Accounts receivable
17,300
9,300
Merchandise inventory
Prepaid expenses
24.800
Prou

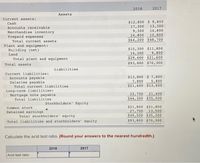
Transcribed Image Text:2018
2017
Assets
Current assets:
$12,800 $ 9,800
17,300
9,300
Cash
Accounts receivable
Merchandise inventory
Prepaid expenses
13,300
14,800
10,800
24,800
$64,200 $48,700
Total current assets
Plant and equipment:
Building (net)
$15,300 $11,800
14,300
9,800
Land
Total plant and equipment
$29,600 $21,600
Total assets
$93,800 $70,300
Liabilities
Current liabilities:
Accounts payable
Salaries payable
Total current liabilities
$13,800 $ 7,800
7,800
$21,600 $13,600
5,800
Long-term liabilities:
Mortgage note payable
Total liabilities
22,700
$44,300 $35,000
21,400
Stockholders' Equity
$21,800 $21,800
27,700
$49,500 $35,300
$93,800 $70,300
Common stock
Retained earnings
13,500
Total stockholders' equity
Total liabilities and stockholders' equity
Calculate the acid test ratio. (Round your answers to the nearest hundredth.)
2018
2017
Acid test ratio
Expert Solution
This question has been solved!
Explore an expertly crafted, step-by-step solution for a thorough understanding of key concepts.
This is a popular solution
Trending nowThis is a popular solution!
Step by stepSolved in 4 steps

Knowledge Booster
Learn more about
Need a deep-dive on the concept behind this application? Look no further. Learn more about this topic, accounting and related others by exploring similar questions and additional content below.Similar questions
- Alpesharrow_forwardCalculate the FCFE of this financial statement.arrow_forwardSales revenue Cost of goods sold Gross profit Expenses Pretax income Income tax expense (30%) Net income 2016 $2,033,000 1,487,000 2017 $2,451,000 2018 $2,717,000 2019 $2,994,000 1,617,000 1,768,000 2,093,000 546,000 834,000 949,000 901,000 488,000 494,000 522,000 532,000 58,000 340,000 427,000 369,000 17,400 102,000 128,100 110,700 $40,600 $238,000 $298,900 $258,300 An audit revealed that in determining these amounts, the ending inventory for 2017 was overstated by $19,000. The company uses a periodic inventory system. 2. Compute the gross profit percentage for each year before the correction and after the correction. Note: Round your answers to the nearest whole percent. 2016 2017 2018 2019 Before correction % % % % After correction % % % %arrow_forward
- dont give answer in image formatarrow_forwardOperating data for Blue Spruce Corp. are presented below. Sales revenue Cost of goods sold Selling expenses Administrative expenses Income tax expense Net income 2022 $822,500 528,300 124,000 74,700 38,700 56,800 2021 $643,500 414,600 79,000 53,000 27,900 69,000 Prepare a schedule showing a vertical analysis for 2022 and 2021. (Round percentages to 1 decimal place, e.g. 12.1%.)arrow_forwardplease answerarrow_forward
- Please provide answer in text form with explanation computation for each steps clearly and correctlyarrow_forwardSales Cost of goods sold Gross profit Operating expenses Income from operations Interest expense Income before income tax Income tax expense Net income (a) 2021 $1,595 900 695 524 171 80 Your answer is incorrect. 91 25 $66 2020 $1,387 $1,208 743 644 411 233 50 183 2019 46 596 612 402 210 40 170 43 $137 $127 Using horizontal analysis, calculate the horizontal percentage of a base-year amount, assuming 2019 is the base year. (Round answers to 1 decimal place, e.g. 5.2%. Enter negative amounts using either a negative sign preceding the number e.g. -45.1% or parentheses e.g. (45.1) %.)arrow_forwardView Policies Current Attempt in Progress Assume Sunland Company has the following reported amounts: Sales revenue $1,000,000, Sales returns and allowances $29,000, Cost of goods sold $649.599, and Operating expenses $215,600. (a) Compute net sales. Net sales $ (b) Compute gross profit. Gross profit S (c) Compute income from operations.arrow_forward
- Sales Sales Revenue Less Net Sales Cost of Goods Sold Gross Profit Operating Expenses Salaries and Wages Expense Sales Discounts Depreciation Expense Utilities Expense Total Operating Expenses Income From Operations Other Revenues and Gains Interest Revenue Other Expenses and Losses Interest Expense Loss on Disposal of Plant Assets Income Before Income Taxes Income Tax Expense Net Income /(Loss) A V V V CULLUMBER COMPANY Income Statement For the Year Ended December 31, 2025 $ 1,856,400 -134,400 i 390,600 i 260,400 i 92,400 i -59,640 -54,600 i $ 1,722,000 -792,120 929,880 -743,400 i 186,480 54,600 -114,240 126,840 -25,200 i 101,640arrow_forwardDon't give answer in imagearrow_forwardUse the following statement of financial position and statement of comprehensive income Blue Bird, Inc. 2018 Statement of comprehensive income Net Sales Less: Cost of Goods Sold Less: Depreciation Earnings Before Interest and Taxes Less: Interest Paid Taxable Income Less: Taxes Net Income Blue Bird, Inc. Statement of financial position Years ended 2017 and 2018 $12,630 8,240 1,010 3,380 750 $2,630 920 $1,710 Cash Accounts rec. Inventory Total 2017 2018 $640 $590 1,200 1,390 2,300 2,470 $4,140 $4,450 Net fixed assets 4,640 5,200 Total assets $8,780 $9,650 Total liabilities & equity Accounts payable Long-term debt Common stock Retained earnings 2017 2018 2,500 2,800 4,000 4,500 1,040 1,690 $8,780 $9,650 Blue Bird, Inc. has 1,500 shares of stock outstanding. The price-earnings ratio for 2018 is 21. What is the market price per share of stock?arrow_forward
arrow_back_ios
SEE MORE QUESTIONS
arrow_forward_ios
Recommended textbooks for you

 AccountingAccountingISBN:9781337272094Author:WARREN, Carl S., Reeve, James M., Duchac, Jonathan E.Publisher:Cengage Learning,
 Accounting Information SystemsAccountingISBN:9781337619202Author:Hall, James A.Publisher:Cengage Learning,
 Horngren's Cost Accounting: A Managerial Emphasis...AccountingISBN:9780134475585Author:Srikant M. Datar, Madhav V. RajanPublisher:PEARSON
 Intermediate AccountingAccountingISBN:9781259722660Author:J. David Spiceland, Mark W. Nelson, Wayne M ThomasPublisher:McGraw-Hill Education
 Financial and Managerial AccountingAccountingISBN:9781259726705Author:John J Wild, Ken W. Shaw, Barbara Chiappetta Fundamental Accounting PrinciplesPublisher:McGraw-Hill Education


Accounting
Accounting
ISBN:9781337272094
Author:WARREN, Carl S., Reeve, James M., Duchac, Jonathan E.
Publisher:Cengage Learning,

Accounting Information Systems
Accounting
ISBN:9781337619202
Author:Hall, James A.
Publisher:Cengage Learning,

Horngren's Cost Accounting: A Managerial Emphasis...
Accounting
ISBN:9780134475585
Author:Srikant M. Datar, Madhav V. Rajan
Publisher:PEARSON

Intermediate Accounting
Accounting
ISBN:9781259722660
Author:J. David Spiceland, Mark W. Nelson, Wayne M Thomas
Publisher:McGraw-Hill Education

Financial and Managerial Accounting
Accounting
ISBN:9781259726705
Author:John J Wild, Ken W. Shaw, Barbara Chiappetta Fundamental Accounting Principles
Publisher:McGraw-Hill Education