
MATLAB: An Introduction with Applications
6th Edition
ISBN: 9781119256830
Author: Amos Gilat
Publisher: John Wiley & Sons Inc
expand_more
expand_more
format_list_bulleted
Related questions
Concept explainers
Question
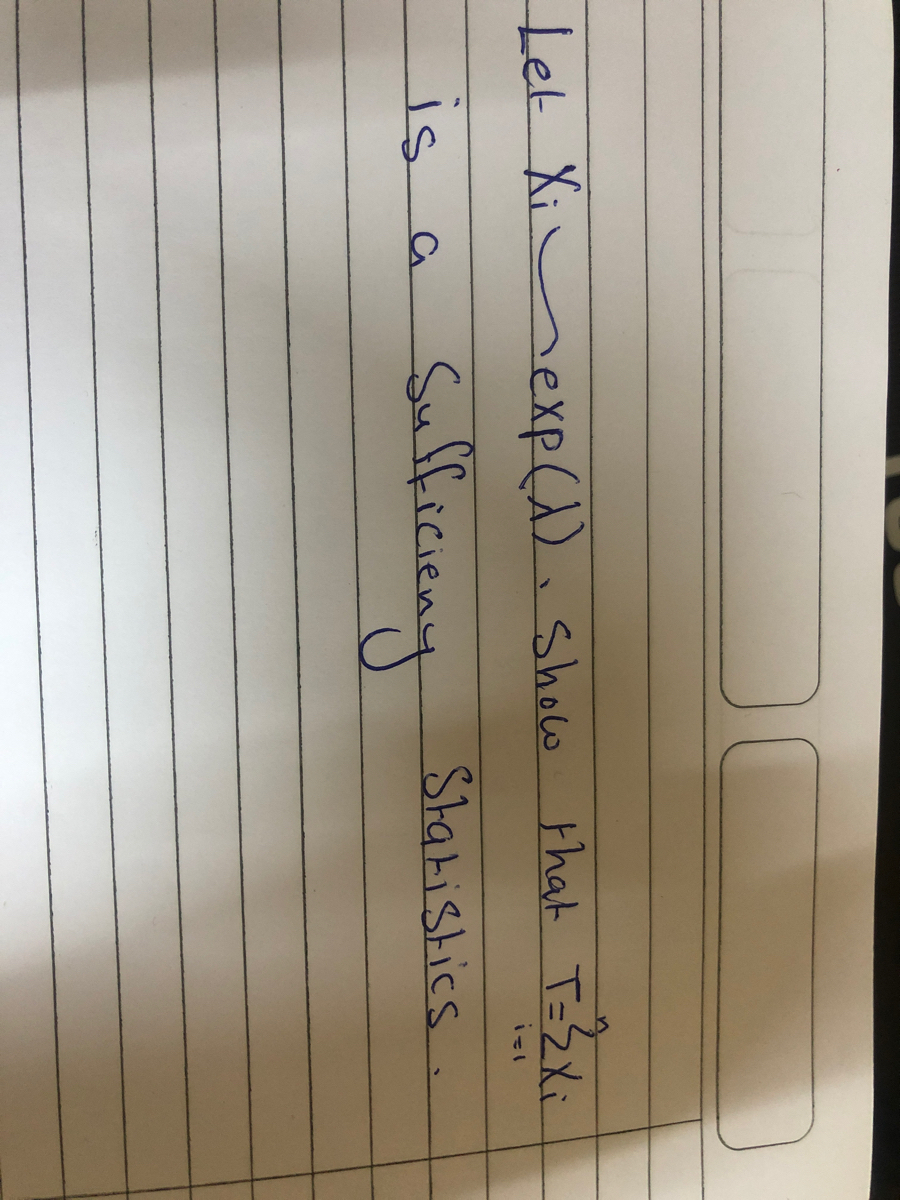

Transcribed Image Text:Let Xi mexp(A). Show
that T-ZXi
Sulficieay
is
Statistics
Expert Solution
This question has been solved!
Explore an expertly crafted, step-by-step solution for a thorough understanding of key concepts.

Step by stepSolved in 2 steps with 2 images

Knowledge Booster


Learn more about
Need a deep-dive on the concept behind this application? Look no further. Learn more about this topic, statistics and related others by exploring similar questions and additional content below.Similar questions
- 8/20 Compute the correlation coefficient and determine whether there is a linear relation between X and Y.arrow_forwardA study reports data on the effects of the drug tamoxifen on change in the level of cortisol-binding globulin (CBG) of patients during treatment. With age = x and ACBG = y, summary values are n = 26, Ex; = 1620, 2(x₁ - x)² = 3756.96, y₁ = 281.9, (y₁ - y)² = 465.34, and Ex,y; = 16,733. (a) Compute a 90% CI for the true correlation coefficient p. (Round your answers to four decimal places.) (b) Test Ho: p = -0.5 versus H₂: P < -0.5 at level 0.05. Calculate the test statistic and determine the P-value. (Round your test statistic to two decimal places and your P-value to four decimal places.) P-value = State the conclusion in the problem context. O Reject Ho. There is no evidence that p < -0.5. O Fail to reject Ho. There is evidence that p < -0.5. O Reject Ho. There is evidence that p < -0.5. O Fail to reject Ho. There is no evidence that p < -0.5. (c) In a regression analysis of y on x, what proportion of variation in change of cortisol-binding globulin level could be explained by…arrow_forward4, 12. How Call v. 13. Suppose that two raters (Rater A and Rater B) each assign pirysica attractiveness scO = not at all attractive to 10 = extremely attractive) to a set of seven facial photogranhe 21 %3D Pearson's r can be used as an index of interrater reliability or agreement on quantitative ratings. A correlation of +1 would indicate perfect rank-order agreement between rate while an r of 0 would indicate no agreement about judgments of relative attractiveness An r of .8 to .9 is considered desirable when reliability is assessed. For this example, Rater A's score is the X variable and Rater B's score is the Y variable. The ratings are as followe F follows: Photo Rater A Rater B 1 3. 5. 8. 6. 7. 8. 6. 4. 6. 10 6. 7. 5. 4. a. Compute the Pearson correlation between the Rater A and Rater B attractiveness ratings. What is the obtained r value? b. Is your obtained r statistically significant (using a =.05, two tailed)? Are the Rater A and Rater B scores "reliable"? Is there good or…arrow_forward
- #18arrow_forward(d) Does a linear relation exist between the speed at which a ball is hit and the distance the ball travels? The variables speed at which the ball is hit and the distance the ball travels are positively associated because r is positive and the absolute value of the correlation coefficient is greater than the critical value ( ) (Round to three decimal places as needed.)arrow_forwardYour company manufactures plastic wrap for food storage. The tear resistance of the wrap, denoted by X, must be controlled so that the wrap can be torn off the roll without too much effort but it does not tear too easily when in use. In a series of tests (see data table below), 15 rolls of wrap are made under carefully controlled conditions and the tear resistance of each rool is measured. The results are used as the basis of a quality assurance specification. If X for a subsequently produced roll falls more than two standard deviations away from the test period average, the process is declared out of specification and production is suspended for routine maintenance. Roll 1 2 3 4 5 6 7 8 9 10 11 12 13 14 15 X 134 131 129 133 135 131 134 130 131 136 129 130 133 130 133 a)What is the mean tear resistance? Enter your answer to the correct number of significant figures. b)What is the…arrow_forward
arrow_back_ios
arrow_forward_ios
Recommended textbooks for you
- MATLAB: An Introduction with ApplicationsStatisticsISBN:9781119256830Author:Amos GilatPublisher:John Wiley & Sons Inc
 Probability and Statistics for Engineering and th...StatisticsISBN:9781305251809Author:Jay L. DevorePublisher:Cengage Learning
 Statistics for The Behavioral Sciences (MindTap C...StatisticsISBN:9781305504912Author:Frederick J Gravetter, Larry B. WallnauPublisher:Cengage Learning
  Elementary Statistics: Picturing the World (7th E...StatisticsISBN:9780134683416Author:Ron Larson, Betsy FarberPublisher:PEARSON
 The Basic Practice of StatisticsStatisticsISBN:9781319042578Author:David S. Moore, William I. Notz, Michael A. FlignerPublisher:W. H. Freeman
 Introduction to the Practice of StatisticsStatisticsISBN:9781319013387Author:David S. Moore, George P. McCabe, Bruce A. CraigPublisher:W. H. Freeman
MATLAB: An Introduction with Applications
Statistics
ISBN:9781119256830
Author:Amos Gilat
Publisher:John Wiley & Sons Inc
Probability and Statistics for Engineering and th...
Statistics
ISBN:9781305251809
Author:Jay L. Devore
Publisher:Cengage Learning
Statistics for The Behavioral Sciences (MindTap C...
Statistics
ISBN:9781305504912
Author:Frederick J Gravetter, Larry B. Wallnau
Publisher:Cengage Learning
Elementary Statistics: Picturing the World (7th E...
Statistics
ISBN:9780134683416
Author:Ron Larson, Betsy Farber
Publisher:PEARSON
The Basic Practice of Statistics
Statistics
ISBN:9781319042578
Author:David S. Moore, William I. Notz, Michael A. Fligner
Publisher:W. H. Freeman
Introduction to the Practice of Statistics
Statistics
ISBN:9781319013387
Author:David S. Moore, George P. McCabe, Bruce A. Craig
Publisher:W. H. Freeman