MATLAB: An Introduction with Applications
6th Edition
ISBN: 9781119256830
Author: Amos Gilat
Publisher: John Wiley & Sons Inc
expand_more
expand_more
format_list_bulleted
Concept explainers
Question

Transcribed Image Text:4,
12.
How Call v.
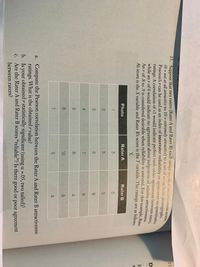
13. Suppose that two raters (Rater A and Rater B) each assign pirysica attractiveness scO
= not at all attractive to 10 = extremely attractive) to a set of seven facial photogranhe
21
%3D
Pearson's r can be used as an index of interrater reliability or agreement on
quantitative
ratings. A correlation of +1 would indicate perfect rank-order agreement between rate
while an r of 0 would indicate no agreement about judgments of relative attractiveness
An r of .8 to .9 is considered desirable when reliability is assessed. For this example, Rater
A's score is the X variable and Rater B's score is the Y variable. The ratings are as followe
F
follows:
Photo
Rater A
Rater B
1
3.
5.
8.
6.
7.
8.
6.
4.
6.
10
6.
7.
5.
4.
a. Compute the Pearson correlation between the Rater A and Rater B attractiveness
ratings. What is the obtained r value?
b. Is your obtained r statistically significant (using a =.05, two tailed)?
Are the Rater A and Rater B scores "reliable"? Is there good or poor agreement
C.
between raters?
Expert Solution
This question has been solved!
Explore an expertly crafted, step-by-step solution for a thorough understanding of key concepts.
This is a popular solution
Trending nowThis is a popular solution!
Step by stepSolved in 2 steps

Knowledge Booster
Learn more about
Need a deep-dive on the concept behind this application? Look no further. Learn more about this topic, statistics and related others by exploring similar questions and additional content below.Similar questions
- Is the average age of armed services personnel related to the average amount of length of service in months? The data are shown in table below. a. Draw a scatter plot. What does it show? b. Compute the value of the correlation coefficient. c. Test the significance of the correlation coefficient at a = 0.05.arrow_forwardListed below are the amounts of bills for dinner and the amounts of the tips that were left. Construct a scatterplot, find the value of the linear correlation coefficient r, and find the P-value of r. Determine whether there is sufficient evidence to support a claim of linear correlation between the two variables. Use a significance level of α=0.01. If everyone were to tip with the same percentage, what should be the value of r? Bill (dollars) 31.65 53.83 87.10 103.64 60.34 109.80 Tip (dollars) 3.74 5.76 14.73 16.86 7.44 20.73 1. The linear correlation coefficient is r= 2. What are the null and alternative hypotheses? 3. The test statistic is t= 4. The P-Value is P=arrow_forwardwhat are the critical values r =?arrow_forward
- 1.Consider the accompanying data on and (%) at failure of the cheese. [Note: Theresearchers were Italian and used real mozzarella cheese, not the poor cousin widelyavailable in the United States.]a. Construct a scatter plot.b. What does the plot suggest about the nature of the relationship between the twovariables?c. Calculate coefficient of correlation between x and y. Comment on the result. 2.Scraps of iron were selected on the basis of their densities, x, and their iron contents, y,were measured. The results were as follows:x 2.8 2.9 3.0 3.1 3.2 3.2 3.2 3.3 3.4y 27 23 30 28 30 32 34 33 30(i) Plot the data(Scatter Diagram)9 | P a g e(ii) Find the regression equation of y on x by the method of least squares(iii) Comment on Goodness of fit of the fitted line(iv) Predict y for given x=3.5arrow_forwardThere is a negative correlation between the average litres of wine consumed by residents of a country and the incidence of national coronary deaths. Explain why correlation in this case does not imply causation by suggesting a third variable z that explains the correlation. Is z a common response or a confounding variable? Draw a digraph illustrating the between x, y, and zarrow_forward
arrow_back_ios
arrow_forward_ios
Recommended textbooks for you
 MATLAB: An Introduction with ApplicationsStatisticsISBN:9781119256830Author:Amos GilatPublisher:John Wiley & Sons Inc
 Probability and Statistics for Engineering and th...StatisticsISBN:9781305251809Author:Jay L. DevorePublisher:Cengage Learning
 Statistics for The Behavioral Sciences (MindTap C...StatisticsISBN:9781305504912Author:Frederick J Gravetter, Larry B. WallnauPublisher:Cengage Learning
 Elementary Statistics: Picturing the World (7th E...StatisticsISBN:9780134683416Author:Ron Larson, Betsy FarberPublisher:PEARSON
 The Basic Practice of StatisticsStatisticsISBN:9781319042578Author:David S. Moore, William I. Notz, Michael A. FlignerPublisher:W. H. Freeman
 Introduction to the Practice of StatisticsStatisticsISBN:9781319013387Author:David S. Moore, George P. McCabe, Bruce A. CraigPublisher:W. H. Freeman

MATLAB: An Introduction with Applications
Statistics
ISBN:9781119256830
Author:Amos Gilat
Publisher:John Wiley & Sons Inc

Probability and Statistics for Engineering and th...
Statistics
ISBN:9781305251809
Author:Jay L. Devore
Publisher:Cengage Learning

Statistics for The Behavioral Sciences (MindTap C...
Statistics
ISBN:9781305504912
Author:Frederick J Gravetter, Larry B. Wallnau
Publisher:Cengage Learning

Elementary Statistics: Picturing the World (7th E...
Statistics
ISBN:9780134683416
Author:Ron Larson, Betsy Farber
Publisher:PEARSON

The Basic Practice of Statistics
Statistics
ISBN:9781319042578
Author:David S. Moore, William I. Notz, Michael A. Fligner
Publisher:W. H. Freeman

Introduction to the Practice of Statistics
Statistics
ISBN:9781319013387
Author:David S. Moore, George P. McCabe, Bruce A. Craig
Publisher:W. H. Freeman