
MATLAB: An Introduction with Applications
6th Edition
ISBN: 9781119256830
Author: Amos Gilat
Publisher: John Wiley & Sons Inc
expand_more
expand_more
format_list_bulleted
Related questions
Question
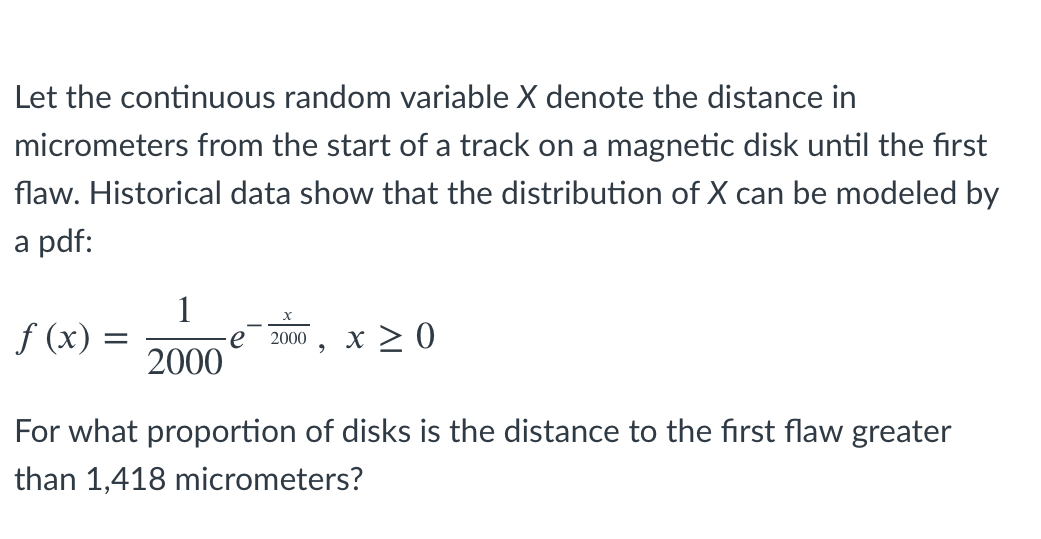

Transcribed Image Text:Let the continuous random variable X denote the distance in
micrometers from the start of a track on a magnetic disk until the first
flaw. Historical data show that the distribution of X can be modeled by
a pdf:
1
f (x) =
x > 0
e
2000
2000
For what proportion of disks is the distance to the first flaw greater
than 1,418 micrometers?
Expert Solution
This question has been solved!
Explore an expertly crafted, step-by-step solution for a thorough understanding of key concepts.

This is a popular solution

Trending nowThis is a popular solution!

Step by stepSolved in 2 steps

Knowledge Booster


Learn more about
Need a deep-dive on the concept behind this application? Look no further. Learn more about this topic, statistics and related others by exploring similar questions and additional content below.Similar questions
- Let x = red blood cell (RBC) count in millions per cubic millimeter of whole blood. For healthy females, x has an approximately normal distribution with mean ? = 4.3 and standard deviation ? = 0.5. (a) Convert the x interval, 4.5 < x, to a z interval. (Round your answer to two decimal places.) < z(b) Convert the x interval, x < 4.2, to a z interval. (Round your answer to two decimal places.)z < (c) Convert the x interval, 4.0 < x < 5.5, to a z interval. (Round your answers to two decimal places.) < z < (d) Convert the z interval, z < −1.44, to an x interval. (Round your answer to one decimal place.)x < (e) Convert the z interval, 1.28 < z, to an x interval. (Round your answer to one decimal place.) < x(f) Convert the z interval, −2.25 < z < −1.00, to an x interval. (Round your answers to one decimal place.) < x <arrow_forwardIf the power received at the MU is lognormal with standard deviation of 9dB, the outage probability can be expressed as erfc(x)/2. determine the value of x given the average power received is -97dBm and the threshold power is -101dBm.arrow_forwardFrom generation to generation, the mean age when smokers first start to smoke varies. However, the standard deviation of that age remains constant at around 2.1 years. A survey of 38 smokers of this generation was done to see if the mean starting age is at least 19. The sample mean was 18.1 with a sample standard deviation of 1.3. Do the data support the claim at the 5% level? (i) Alpha (Enter an exact number as an integer, fraction, or decimal.)? =arrow_forward
- Suppose that X follows a lognormal distribution with w^2=4 and E(X)=10,000 a. Find the parameter theta for the distribution. Use 4 digits after the decimal point: b. Find the standard deviation of the process: Use 4 digits after the decimal point:arrow_forwardIQ is normally distributed with a mean of 100 and a standard deviation of 15. Suppose one individual is randomly chosen. Let X = IQ of an individual. (a) Find the z-score for an IQ of 99, rounded to three decimal places. (b) Find the probability that the person has an IQ greater than 99. (c) Shade the area corresponding to this probability in the graph below. (Hint: The x- axis is the z-score. Use your z-score from part (a), rounded to one decimal place). Shade: Left of a value -1 -1.5 0 +). Click and drag the arrows to adjust the values. 1 2 (d) MENSA is an organization whose members have the top 2% of all IQs. Find the minimum IQ needed to qualify for the MENSA organization. (e) Sketch the graph, and write the probability statement. Edit Insert Formats B I U x₂ x² A => EM e & N 18 (f) The middle 50% of IQs fall between what two values? (g) Sketch the graph and write the probability statement. Edit Insert Formats BIUX₂ X² A E = = E EC P R N • Σ+ Σ Α Σ+ Σ Αarrow_forwardA certain variable has a bell-shaped distribution with mean μ=176.16μ=176.16 and standard deviation σ=4.9σ=4.9. You observe a value of x=184x=184. Is this a TYPICAL value of the variable (within 2 standard deviations of the mean), or an UNUSUAL one (more than 2 standard deviations from the mean)?arrow_forward
arrow_back_ios
arrow_forward_ios
Recommended textbooks for you
- MATLAB: An Introduction with ApplicationsStatisticsISBN:9781119256830Author:Amos GilatPublisher:John Wiley & Sons Inc
 Probability and Statistics for Engineering and th...StatisticsISBN:9781305251809Author:Jay L. DevorePublisher:Cengage Learning
 Statistics for The Behavioral Sciences (MindTap C...StatisticsISBN:9781305504912Author:Frederick J Gravetter, Larry B. WallnauPublisher:Cengage Learning
  Elementary Statistics: Picturing the World (7th E...StatisticsISBN:9780134683416Author:Ron Larson, Betsy FarberPublisher:PEARSON
 The Basic Practice of StatisticsStatisticsISBN:9781319042578Author:David S. Moore, William I. Notz, Michael A. FlignerPublisher:W. H. Freeman
 Introduction to the Practice of StatisticsStatisticsISBN:9781319013387Author:David S. Moore, George P. McCabe, Bruce A. CraigPublisher:W. H. Freeman
MATLAB: An Introduction with Applications
Statistics
ISBN:9781119256830
Author:Amos Gilat
Publisher:John Wiley & Sons Inc
Probability and Statistics for Engineering and th...
Statistics
ISBN:9781305251809
Author:Jay L. Devore
Publisher:Cengage Learning
Statistics for The Behavioral Sciences (MindTap C...
Statistics
ISBN:9781305504912
Author:Frederick J Gravetter, Larry B. Wallnau
Publisher:Cengage Learning
Elementary Statistics: Picturing the World (7th E...
Statistics
ISBN:9780134683416
Author:Ron Larson, Betsy Farber
Publisher:PEARSON
The Basic Practice of Statistics
Statistics
ISBN:9781319042578
Author:David S. Moore, William I. Notz, Michael A. Fligner
Publisher:W. H. Freeman
Introduction to the Practice of Statistics
Statistics
ISBN:9781319013387
Author:David S. Moore, George P. McCabe, Bruce A. Craig
Publisher:W. H. Freeman