
MATLAB: An Introduction with Applications
6th Edition
ISBN: 9781119256830
Author: Amos Gilat
Publisher: John Wiley & Sons Inc
expand_more
expand_more
format_list_bulleted
Related questions
Concept explainers
Topic Video
Question
Journal of Economic, Political and Business Analysis XIV (2) delivers a report on the stagnation of the ceramic industry in Indonesia. The causes of stagnation are inefficiency, decreased purchasing power and increased production costs. Following is the development of sales in 2001 and 2002.
• Calculate the average, median and mode scores for the 2 years of sales
• How is the relationship between these concentration sizes.
• What are your comments on the development of sales from 2001 to 2002? And in what year the sales frequency of the above companies was more stable.
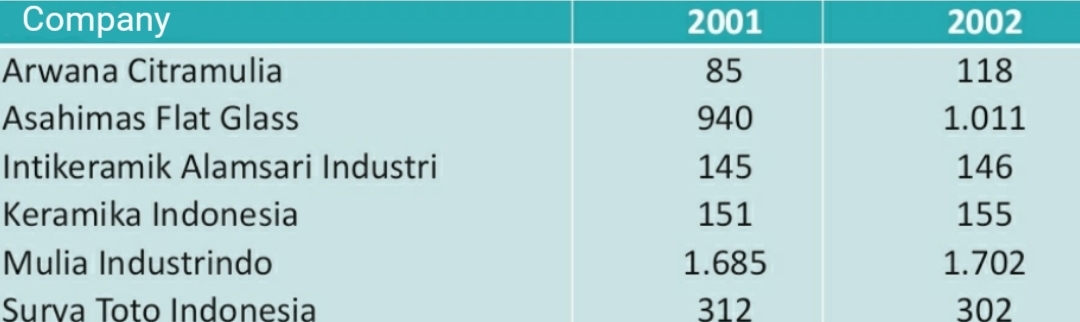

Transcribed Image Text:Company
2001
2002
Arwana Citramulia
85
118
Asahimas Flat Glass
940
1.011
Intikeramik Alamsari Industri
145
146
Keramika Indonesia
151
155
Mulia Industrindo
1.685
1.702
Surva Toto lIndonesia
312
302
Expert Solution
This question has been solved!
Explore an expertly crafted, step-by-step solution for a thorough understanding of key concepts.

Step by stepSolved in 4 steps

Knowledge Booster


Learn more about
Need a deep-dive on the concept behind this application? Look no further. Learn more about this topic, statistics and related others by exploring similar questions and additional content below.Similar questions
- The index of leading economic indicators, compiled and published by the U.S. National Bureau of Economic Research, is composed of 12 time series, such as the average work hours of production in manufacturing, manufacturers’ new orders, and money supply. This index and similar indexes are designed to move up or down before the economy begins to move the same way. Thus, an economist has statistical evidence to forecast future trends.You want to construct a leading indicator for Erie County in upstate New York. The index is to be based on 2000 data. Because of the time and work involved, you decide to use only four time series. As an experiment, you select these four series: unemployment in the county, a composite index of county stock prices, the County Price Index, and retail sales. Here are the figures for 2000 and 2018. The weights you assign are unemployment rate 20%, stock prices 40%, County Price Index 25%, and retail sales 15%. (Round your answers to 1 decimal place.) a. Using…arrow_forwardThe Ministry of Natural Resources is about to embark on an exercise to estimate the potential for the development of a Non-Timber Forest Products industry in Region One, Barima/Waini. A survey is to be carried out with the aim of establishing quantitative benchmarks regarding the Region’s resource endowment. can you help me to suggest an appropriate problem statement to be associated with the activity?arrow_forwardWhat do you mean by the impact multiplier or impact propensity? How is it different from the long-run propensity (LRP)? Discuss with an appropriate example of the distributive lag model.arrow_forward
- (b) Table 1 shows consumables usage data from a leading manufacturer. Forecast the demand for August, September and October using: i) a three-month moving average ii) a four-month weighted moving average using 50 percent of the actual usage for the most recent month, 20 percent of two months ago, 15 percent of three months ago and 15 percent of four months ago. Using an example, explain what are the benefits of using the weighted moving average method of forecasting instead? Month February 2023 March 2023 April 2023 May 2023 June 2023 July 2023 Consumables Used 884 892 972 990 956 880arrow_forward13. What is the Relative Risk for these data?arrow_forward
arrow_back_ios
arrow_forward_ios
Recommended textbooks for you
- MATLAB: An Introduction with ApplicationsStatisticsISBN:9781119256830Author:Amos GilatPublisher:John Wiley & Sons Inc
 Probability and Statistics for Engineering and th...StatisticsISBN:9781305251809Author:Jay L. DevorePublisher:Cengage Learning
 Statistics for The Behavioral Sciences (MindTap C...StatisticsISBN:9781305504912Author:Frederick J Gravetter, Larry B. WallnauPublisher:Cengage Learning
  Elementary Statistics: Picturing the World (7th E...StatisticsISBN:9780134683416Author:Ron Larson, Betsy FarberPublisher:PEARSON
 The Basic Practice of StatisticsStatisticsISBN:9781319042578Author:David S. Moore, William I. Notz, Michael A. FlignerPublisher:W. H. Freeman
 Introduction to the Practice of StatisticsStatisticsISBN:9781319013387Author:David S. Moore, George P. McCabe, Bruce A. CraigPublisher:W. H. Freeman
MATLAB: An Introduction with Applications
Statistics
ISBN:9781119256830
Author:Amos Gilat
Publisher:John Wiley & Sons Inc
Probability and Statistics for Engineering and th...
Statistics
ISBN:9781305251809
Author:Jay L. Devore
Publisher:Cengage Learning
Statistics for The Behavioral Sciences (MindTap C...
Statistics
ISBN:9781305504912
Author:Frederick J Gravetter, Larry B. Wallnau
Publisher:Cengage Learning
Elementary Statistics: Picturing the World (7th E...
Statistics
ISBN:9780134683416
Author:Ron Larson, Betsy Farber
Publisher:PEARSON
The Basic Practice of Statistics
Statistics
ISBN:9781319042578
Author:David S. Moore, William I. Notz, Michael A. Fligner
Publisher:W. H. Freeman
Introduction to the Practice of Statistics
Statistics
ISBN:9781319013387
Author:David S. Moore, George P. McCabe, Bruce A. Craig
Publisher:W. H. Freeman