
A First Course in Probability (10th Edition)
10th Edition
ISBN: 9780134753119
Author: Sheldon Ross
Publisher: PEARSON
expand_more
expand_more
format_list_bulleted
Related questions
Concept explainers
Question
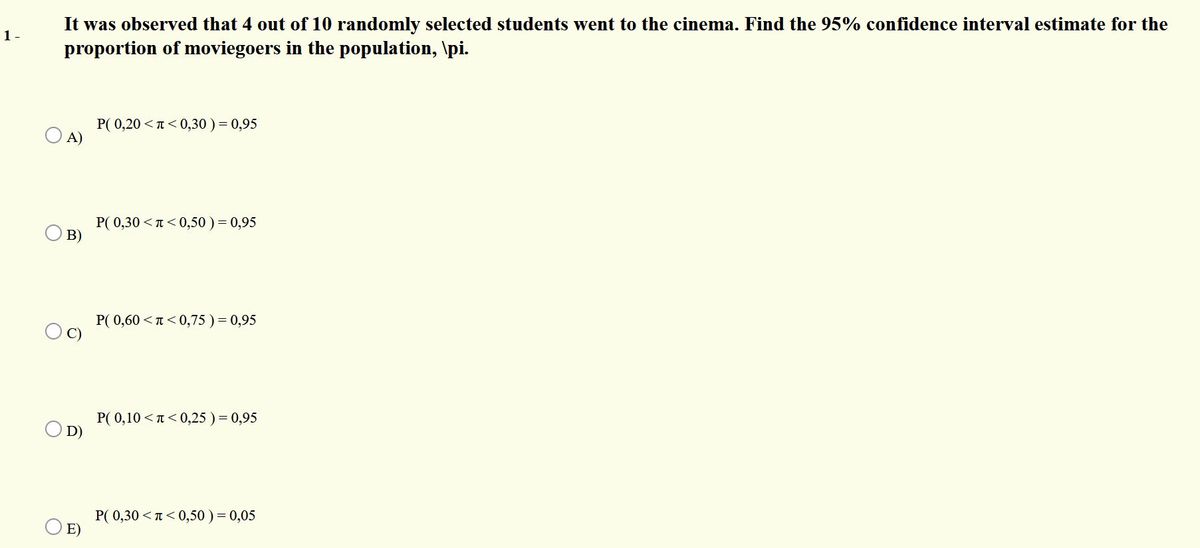

Transcribed Image Text:It was observed that 4 out of 10 randomly selected students went to the cinema. Find the 95% confidence interval estimate for the
1 -
proportion of moviegoers in the population, \pi.
P( 0,20 <T <0,30 ) = 0,95
A)
P( 0,30 <T< 0,50 )= 0,95
B)
P( 0,60 <n<0,75 )= 0,95
C)
P( 0,10 <T< 0,25 ) = 0,95
D)
P( 0,30 <T<0,50 ) = 0,05
O E)
Expert Solution
arrow_forward
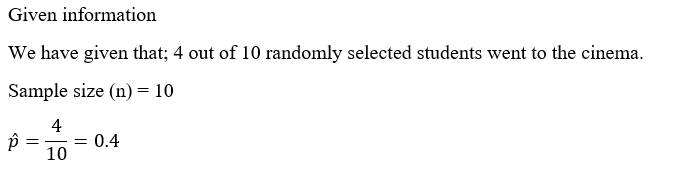
Step 1

Step by stepSolved in 2 steps with 2 images

Knowledge Booster


Learn more about
Need a deep-dive on the concept behind this application? Look no further. Learn more about this topic, probability and related others by exploring similar questions and additional content below.Similar questions
- An SRS of 100 postal employees found that the average time these employees had worked for the postal service was x = 7 years with standard deviation s = 2 years. Assume the distribution of the time the population of employees have worked for the postal service is approximately Normal. A 95% confidence interval for the mean time u the population of postal service employees have spent with the postal service is 7 + 0.525 7 + 0.4 7 + 2 7 + 1.984 barrow_forwardA sample of size 65 gave a mean 7.4 and standard deviation as 1.6 then 95% confidence interval for population mean will be Select one: O (17.008, 17.792) O [27.008, 30.008] O (7.008, 7.792) O (9,265, 10.735)arrow_forwardIn a data management exam, the scores of 567 participants followed a continuous normal distribution. It is known that the mean from all of the students is 75, and to reach the top 1%, students need to score more than (exactly) 92. a) Estimate the number of students who scored between 60 and 70. b) 10 students are good friends. After knowing each other’s marks, they came up with a 95% confidence interval of 65 ± 12 for the population mean. Can you conclude that, with a 90% confidence level, that these students performed worse than average?arrow_forward
- A random sample of size 30 from a normal population yields = 39 and s = 4.9. The lower bound of a 95 percent confidence interval is (Round off upto 2 decimal places).arrow_forwarda. What is the probability of seeing positive change? b. What is the probability of seeing positive change given that the tree is oak? c. Do the data suggest effect and tree type are independent events? yes or noarrow_forwardA random sample of 64 students at a university showed an average age of 25 years and a sample standard deviation of 2 years. The 98 % confidence interval for the true average age of all students in the university is * 20.5 to 29.5. O24.4 to 25.6. 23.0 to 27.0. O 20.0 to 30.0.arrow_forward
arrow_back_ios
arrow_forward_ios
Recommended textbooks for you
- A First Course in Probability (10th Edition)ProbabilityISBN:9780134753119Author:Sheldon RossPublisher:PEARSON

A First Course in Probability (10th Edition)
Probability
ISBN:9780134753119
Author:Sheldon Ross
Publisher:PEARSON