MATLAB: An Introduction with Applications
6th Edition
ISBN: 9781119256830
Author: Amos Gilat
Publisher: John Wiley & Sons Inc
expand_more
expand_more
format_list_bulleted
Topic Video
Question

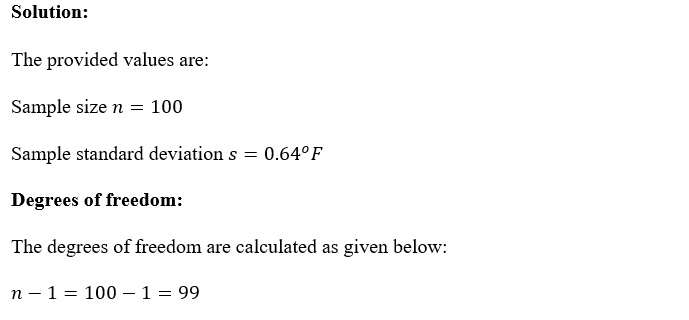
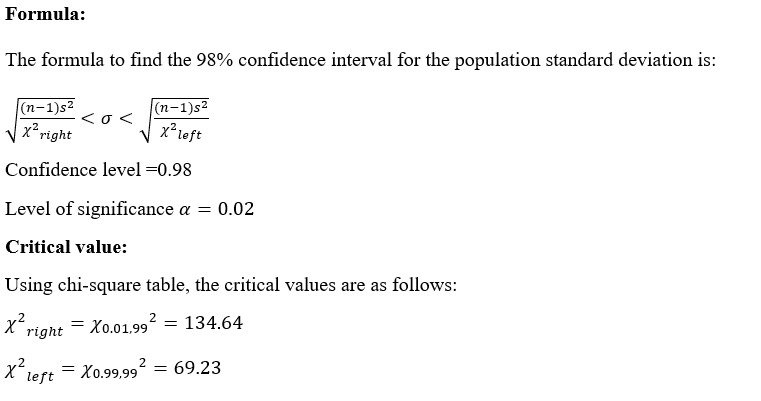
Transcribed Image Text:A simple random sample from a population with a nomal distribution of 100 body temperatures has x= 98.20°F and s 0.64°F. Construct a 98% confidence interval
estimate of the standard deviation of body temperature of alI healthy humans.
Expert Solution
arrow_forward
Step 1

arrow_forward
Step 2

Step by stepSolved in 3 steps with 3 images

Knowledge Booster
Learn more about
Need a deep-dive on the concept behind this application? Look no further. Learn more about this topic, statistics and related others by exploring similar questions and additional content below.Similar questions
- A simple random sample from a population with a normal distribution of 97 body temperatures has x=98.20°F and s=0.63°F. Construct a 99% confidence interval estimate of the standard deviation of body temperature of all healthy humans.arrow_forwardA simple random sample from a population with a normal distribution of 106 body temperatures has x=98.50°F and s=0.64°F. Construct a 98% confidence interval estimate of the standard deviation of body temperature of all healthy humans.arrow_forwardA city planner wants to estimate the average monthly residential water usage in the city. He selected a random sample of 42 households from the city, which gave the mean water usage to be 3409.30 gallons over a one-month period. Based on earlier data, the population standard deviation of the monthly residential water usage in this city is 387.90 gallons. Make a 97% confidence interval for the average monthly residential water usage for all households in this city.arrow_forward
- A sample of 20 automobiles has a pollution by-product release standard deviation of 2.5 ounces when one gallon of gasoline is used. Find the 95% confidence interval of the population variance. using chi table determine the confidence interval of the true population variancearrow_forwardA simple random sample from a population with a normal distribution of 98 body temperatures has x=98.40°F and s=0.68°F. Construct a 90% confidence interval estimate of the standard deviation of body temperature of all healthy humans.arrow_forwardA researcher is comparing the amount of calories in two different lunch special pizzas: Hawaiian and pepperoni. Random samples of 30 Hawaiian and 30 pepperoni are taken. The mean amount of calories in the Hawaiian pizza was 800 calories with a standard deviation of 50 calories and the mean amount of calories in the pepperoni pizza was 1000 with a standard deviation of 100 calories. The population standard deviations are unknown but considered to be equal. What is the 99% confidence interval for the difference between the two population means? O Confidence Interval - (800- - 1000) ± 2.576₁ (50)² 30 Confidence Interval= (800-1000) + (2.663) (79.06, Confidence Interval=(800-1000) ± 2.663, (50) 30 Confidence Interval= (800-1000) + (2.576) (79.06. + (100)² 30 1 1 30 30 + (100)² 30 1 1 30 30 + )arrow_forward
- The blood platelet counts of a group of women have a bell-shaped distribution with a mean of 253.8 and a standard deviation of 61.7. What is the approximate percentage of women with platelet counts between 192.1 and 315.5?arrow_forwardA randomized controlled trial is run to evaluate the effectiveness of a new drug for asthma in children. A total of 250 children are randomized to either the new drug or a placebo (125 per group). The mean age of children assigned to the new drug is 12.4 with a standard deviation of 3.6 years. The mean age of children assigned to the placebo is 13.0 with a standard deviation of 4.0 years. Suppose that there are 63 boys assigned to the new drug group and 58 boys assigned to the placebo group. Is there a statistically significant difference in the proportions of boys assigned to the treatments? Run the appropriate test at a 5% level of significance.arrow_forward
arrow_back_ios
arrow_forward_ios
Recommended textbooks for you
 MATLAB: An Introduction with ApplicationsStatisticsISBN:9781119256830Author:Amos GilatPublisher:John Wiley & Sons Inc
 Probability and Statistics for Engineering and th...StatisticsISBN:9781305251809Author:Jay L. DevorePublisher:Cengage Learning
 Statistics for The Behavioral Sciences (MindTap C...StatisticsISBN:9781305504912Author:Frederick J Gravetter, Larry B. WallnauPublisher:Cengage Learning
 Elementary Statistics: Picturing the World (7th E...StatisticsISBN:9780134683416Author:Ron Larson, Betsy FarberPublisher:PEARSON
 The Basic Practice of StatisticsStatisticsISBN:9781319042578Author:David S. Moore, William I. Notz, Michael A. FlignerPublisher:W. H. Freeman
 Introduction to the Practice of StatisticsStatisticsISBN:9781319013387Author:David S. Moore, George P. McCabe, Bruce A. CraigPublisher:W. H. Freeman

MATLAB: An Introduction with Applications
Statistics
ISBN:9781119256830
Author:Amos Gilat
Publisher:John Wiley & Sons Inc

Probability and Statistics for Engineering and th...
Statistics
ISBN:9781305251809
Author:Jay L. Devore
Publisher:Cengage Learning

Statistics for The Behavioral Sciences (MindTap C...
Statistics
ISBN:9781305504912
Author:Frederick J Gravetter, Larry B. Wallnau
Publisher:Cengage Learning

Elementary Statistics: Picturing the World (7th E...
Statistics
ISBN:9780134683416
Author:Ron Larson, Betsy Farber
Publisher:PEARSON

The Basic Practice of Statistics
Statistics
ISBN:9781319042578
Author:David S. Moore, William I. Notz, Michael A. Fligner
Publisher:W. H. Freeman

Introduction to the Practice of Statistics
Statistics
ISBN:9781319013387
Author:David S. Moore, George P. McCabe, Bruce A. Craig
Publisher:W. H. Freeman