ENGR.ECONOMIC ANALYSIS
14th Edition
ISBN: 9780190931919
Author: NEWNAN
Publisher: Oxford University Press
expand_more
expand_more
format_list_bulleted
Question

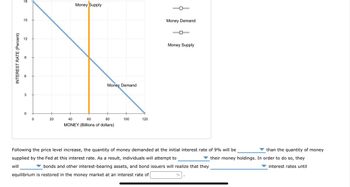
Transcribed Image Text:INTEREST RATE (Percent)
18
15
2
so
3
0
0
20
Money Supply
Money Demand
40
60
80
MONEY (Billions of dollars)
100
120
Money Demand
Money Supply
Following the price level increase, the quantity of money demanded at the initial interest rate of 9% will be
supplied by the Fed at this interest rate. As a result, individuals will attempt to
will
bonds and other interest-bearing assets, and bond issuers will realize that they
equilibrium is restored in the money market at an interest rate of
%
than the quantity of money
their money holdings. In order to do so, they
interest rates until

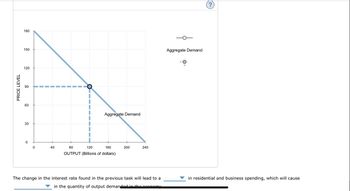
Transcribed Image Text:PRICE LEVEL
180
150
120
90
60
30
0
0
40
O
Aggregate Demand
80
120
160
OUTPUT (Billions of dollars)
200
240
The change in the interest rate found in the previous task will lead to a
in the quantity of output demanded in the economy
Aggregate Demand
in residential and business spending, which will cause
Expert Solution
This question has been solved!
Explore an expertly crafted, step-by-step solution for a thorough understanding of key concepts.
Step by stepSolved in 3 steps with 1 images

Knowledge Booster
Learn more about
Need a deep-dive on the concept behind this application? Look no further. Learn more about this topic, economics and related others by exploring similar questions and additional content below.Similar questions
- C = 50 + 0.9 · (Y – T) I = 50 – 1000 - r where Y is real output and r is the real interest rate. Government purchases and taxes are Ğ = 500, T = 500. The money market equilibrium curve-or LM curve-is where P is the price level and i is the nominal interest rate. The Central Bank (CB) is initially supplying M = 10000 units of money, and expected inflation is zº = 0.05. The long-run aggregate supply (LRAS) is Y, = 1000. Suddenly, there is a climate shock that changes the marginal propensity to consume (MPC), and the consumption function changes to C' = 50 + 0.8 · (Y – T). 1. Explain how the short-run values of (r, i) are determined before the climate shock. 2. Which, if any, of the graphs from Appendix A best depicts the short-run change in the interest rate(s) due to the climate shock? Explain. 3. Which, if any, of the graphs from Appendix B best depicts the short-run change in output and price due to the climate shock? Explain. 4. Which, if any, of the graphs from Appendix C best…arrow_forwardOn the diagram sample (a) show the effect of decrease in money demand (money supply is fixed) on equilibrium on Financial market and on LM curve On the diagram sample (b) show the effect of decrease in money supply (money demand is fixed) on equilibrium on Financial market and on LM curve Hint: LM: M/P = Y*L(i)arrow_forwardQ3. Suppose that the money demand function is given by: Md=$Y (.25-i), where $Y is $100. (a) Derive the bond demand function (B) assuming that wealth is $50. (b) Calculate Md and Bd at interest rates of 5% (use .05) and 10% (use .10). SHOW WORK. (c) How does an increase in the interest rate affect the amount of money people are willing to hold, according to your calculations? How does an increase in the interest rate affect the quantity of bonds people are willing to hold? (d) Suppose the supply of money is currently $20.. Show that the equilibrium interest rate is 5% (.05). (e) Suppose the central bank wants the equilibrium interest rate to rise to 15% (.15). At what level should it set monetary policy? SHOW WORK. What kind of monetary policy (expansionary or contractionary) does this imply?arrow_forward
- b) The Federal Reserve raised the target range for the fed funds rate by 75bps to 2.25%- 2.5% during its July 2022 meeting, the fourth consecutive rate hike, and pushing borrowing costs to the highest level since 2019. Fed fund futures implied investors were pricing in a more than 81% chance of another supersized 75 basis-point interest rate hike in September. Explain to Jay the potential economic forces behind the Fed rate hike and the impact of interest rate changes on the overall economy.arrow_forwardAssume that the expected inflation rises to Еπ₂. Consequently, the expected return on one-year discount bonds (discussed in Question 2) relative to other assets falls for any given price and interest rate. The demand for these bonds falls, and the supply rises. The new equations for the demand and the supply of these bonds are as follows: New demand for bonds: P₂ = -0.7Q₂ + 1050 New supply of bonds: P2 = Q₂ + 850 1. Calculate the new expected equilibrium quantity of bonds. Round your answer to two decimal places. [1] 2. Calculate the new expected equilibrium price of bonds. Round your answer to two decimal places. [1] 3. Calculate the new equilibrium interest rate in this market. Round your answer to two decimal places. [1]arrow_forward0 The Fed exerted downward pressure on interest rates by conducting open market sales which led to an increase in demand for interest sensitive goods such as consumer durables, housing, and investment in physical capital. The Fed exerted upward pressure on interest rates by conducting open market sales which led to an increase in demand for interest sensitive goods such as consumer durables, housing, and investment in physical capital. The Fed exerted downward pressure on interest rates by conducting open market purchases which led to an increase in demand for interest sensitive goods such as consumer durables, housing, and investment in physical capital, The Fed exerted upward pressure on interest rates by conducting open market purchases which led to an increase in demand for interest sensitive goods such as consumer durables, housing, and investment in physical capital. Question 24 3 Which of the following is the most plausible explanation for the shift in the aggregate demand curve…arrow_forward
- 2. The theory of liquidity preference and the downward-slopingaggregate demand curve The following graph shows the money market in a hypothetical economy. The central bank in this economy is called the Fed. Assume that the Fed fixes the quantity of money supplied. Suppose the price level decreases from 90 to 75. Shift the appropriate curve on the graph to show the impact of a decrease in the overall price level on the market for money. 12 Money Supply 10 Money Demand Money Supply MD1 2 MD2 10 20 30 40 50 60 MONEY (Billions of dollars) INTEREST RATE (Percent)arrow_forwardThe following graph shows the money market in a hypothetical economy. The central bank in this economy is called the Fed. Assume that the Fed fixes the quantity of money supplied. Suppose the price level decreases from 90 to 75. Shift the appropriate curve on the graph to show the impact of a decrease in the overall price level on the market for money. Glossary 18 Money Supply Money Demand Money Supply NTEREST RATE (Percent) 15 H i I 1:06 PM 4/29/2022arrow_forwardplease fill in the blanks and finish the graph: The following graph represents the money market for some hypothetical economy. This economy is similar to the United States in the sense that it has a central bank called the Fed, but a major difference is that this economy is closed (and therefore does not have any interaction with other world economies). The money market is currently in equilibrium at an interest rate of 2.5% and a quantity of money equal to $0.4 trillion, designated on the graph by the grey symbol.Suppose the Fed announces that it is lowering its target interest rate by 75 basis points, or 0.75 percentage points. To do this, the Fed will use open market operations to the money by the public. Use the green line (triangle symbol) on the previous graph to illustrate the effects of this policy by placing the new money supply curve (MS) in the correct location. Place the black point (plus symbol) at the new equilibrium interest rate and quantity of money. Use the green line…arrow_forward
- c) The demand for money is given by: Md 0.5Y - 2000r i. If the income level is Y = 1000, and the interest rate is r= 10%, what is the demand for money? ii. What is the equilibrium level of interest rates when the supply of money is equal to 200? iii. What happens to the equilibrium rate of interest when increase in the money supply to 400?arrow_forwardIdentity the effect of on either demand or supply curve and the equilibrium interest rates on:- Increase in tax Recession in the economy Decrease in bank rates Surplus budget.arrow_forwardContinued monetary tightening 05 October 2022 The Monetary Policy Committee today increased the Official Cash Rate (OCR) to 3.5% from 3.0%. The Committee agreed it remains appropriate to continue to tighten monetary conditions at pace to maintain price stability and contribute to maximum sustainable employment. Core consumer price inflation is too high and labour resources are scarce. Global consumer price pressures remain heightened. The global demand for goods and services is exceeding supply capacity, putting upward pressure on prices. Food and energy prices are being particularly exacerbated by the war in Ukraine. A recent decline in oil prices and an easing in some supply-chain constraints have seen headline inflation measures fall in some countries. However, core measures of inflation have risen and persist. Central banks are tightening monetary conditions, implying a weaker growth outlook for New Zealand's trading partners. In New Zealand, the level of domestic spending has…arrow_forward
arrow_back_ios
SEE MORE QUESTIONS
arrow_forward_ios
Recommended textbooks for you

 Principles of Economics (12th Edition)EconomicsISBN:9780134078779Author:Karl E. Case, Ray C. Fair, Sharon E. OsterPublisher:PEARSON
 Engineering Economy (17th Edition)EconomicsISBN:9780134870069Author:William G. Sullivan, Elin M. Wicks, C. Patrick KoellingPublisher:PEARSON
 Principles of Economics (MindTap Course List)EconomicsISBN:9781305585126Author:N. Gregory MankiwPublisher:Cengage Learning
 Managerial Economics: A Problem Solving ApproachEconomicsISBN:9781337106665Author:Luke M. Froeb, Brian T. McCann, Michael R. Ward, Mike ShorPublisher:Cengage Learning
 Managerial Economics & Business Strategy (Mcgraw-...EconomicsISBN:9781259290619Author:Michael Baye, Jeff PrincePublisher:McGraw-Hill Education


Principles of Economics (12th Edition)
Economics
ISBN:9780134078779
Author:Karl E. Case, Ray C. Fair, Sharon E. Oster
Publisher:PEARSON

Engineering Economy (17th Edition)
Economics
ISBN:9780134870069
Author:William G. Sullivan, Elin M. Wicks, C. Patrick Koelling
Publisher:PEARSON

Principles of Economics (MindTap Course List)
Economics
ISBN:9781305585126
Author:N. Gregory Mankiw
Publisher:Cengage Learning

Managerial Economics: A Problem Solving Approach
Economics
ISBN:9781337106665
Author:Luke M. Froeb, Brian T. McCann, Michael R. Ward, Mike Shor
Publisher:Cengage Learning

Managerial Economics & Business Strategy (Mcgraw-...
Economics
ISBN:9781259290619
Author:Michael Baye, Jeff Prince
Publisher:McGraw-Hill Education